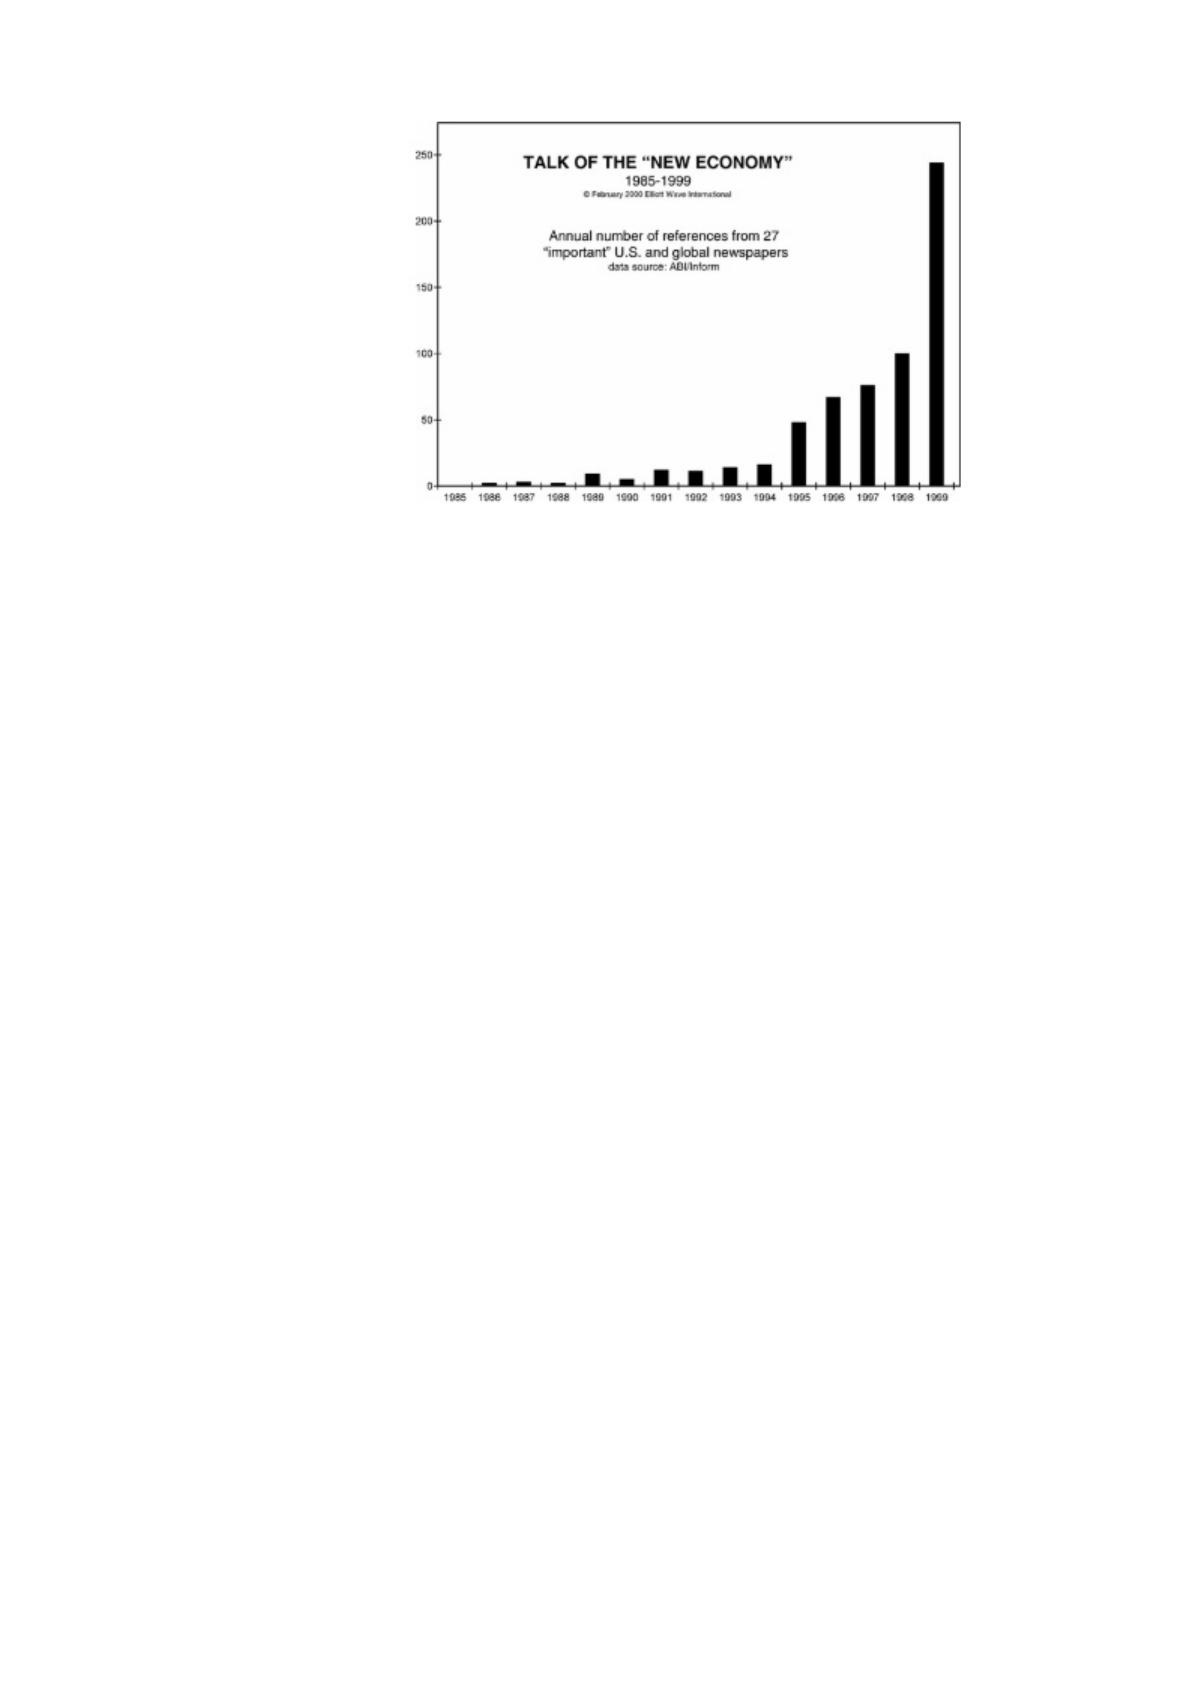
154
Figure 19
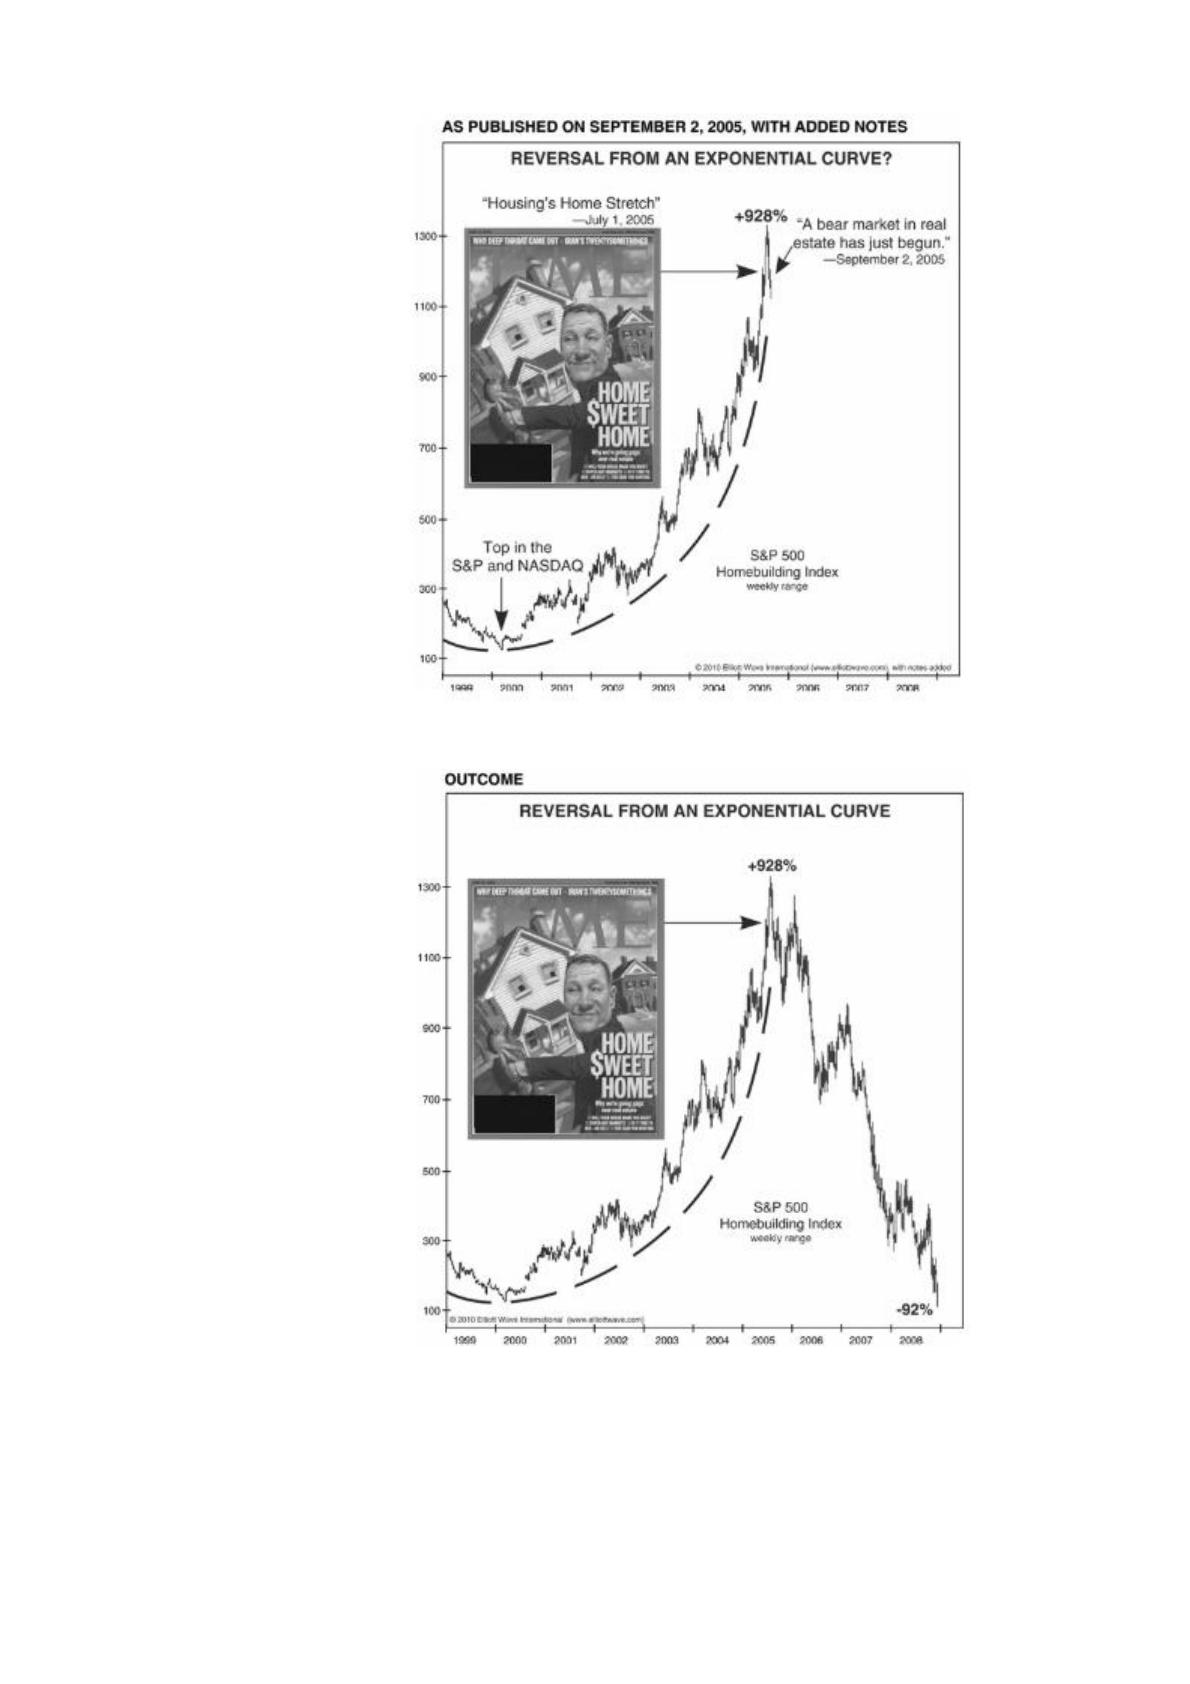
They did the same thing in the summer of 2005 with respect to real estate
prices. Figure 21 shows that the S&P 500 Homebuilding Stock Index had risen 928%
over the preceding five years. Business Week, having just polled a bevy of
economists, reported in its June 22, 2005 issue that the profession was unanimous
that housing prices were not “due to plunge.” All but one of the economists polled
concurred that the very idea of “a national housing bubble is relatively silly.” This
was complacency at its smuggest. As Chapter 5 demonstrates and as Chapter 23
explains, experts’ denial of a bubble is good evidence that one exists. A week later,
The Elliott Wave Financial Forecast published a chart of the S&P Homebuilding
Index along with a Time magazine cover titled “Home $weet Home” depicting an
owner hugging his house. As Paul Montgomery demonstrated, the very appearance of
a financial-market cover story in a general-interest magazine indicates an extreme in
optimism or pessimism relating to the featured market. Kendall and Hochberg titled
their chart “Housing’s Home Stretch.” On September 2 they issued an updated chart
titled “Reversal of an Exponential Curve?” and confirmed, “We think a bear market
in real estate has just begun.” The reversal had occurred between those two
assessments, in August. Figure 21 shows what happened to homebuilding stocks: a
staggering 92% decline in just three years. Real estate prices followed, with an eight-
month lag.
155
Figure 20
Figure 21
As noted earlier, governments herd, too, and their actions tend to lag
substantially the trends in social mood. Kendall and Hochberg applied this

156
observation in real time in June 2007. Their analysis offers a classic example of the
difference between linear projection based on the mechanics paradigm and fractal
projection based on the socionomics paradigm:
The establishment of “sovereign wealth funds” is another sign that a downturn
is falling into place and that governments are doing everything in their power to make
the worst of it. These funds, which dozens of countries have established in recent
weeks, invest a country’s reserves and natural-resource earnings in global financial
assets that are much riskier than the extra-safe bonds that governments have
traditionally owned. Based on current rates of formation, projections show these
investment pools rocketing from current levels of $1.5 trillion to $20 trillion over the
next 20 years. On the basis of these forecasts, many Wall Street analysts now
envision a “multi-trillion dollar industry” that will “transform the shape of the world
economy and provide a massive boost for share prices in coming decades.” Says one
e-mailer to these offices, “Think of the vast sums of money that could flow into the
U.S. stock market.” But as we said last month with respect to one of the initial
sovereign wealth fund investments—China’s investment in Blackstone—these kinds
of investments are not bullish; they are a “classic precondition to a reversal.” They
express how utterly conventional the drive into riskier financial instruments has
become. With governments making the move, complacency toward risk has surely
attained an extreme.
This kind of prediction is strikingly counterintuitive to believers in exogenous
cause. Yet true to socionomic form, just as investors prepared for “vast sums of
money” to create “a massive boost for share prices,” stock markets peaked
worldwide, and commodities followed, plunging—along with these funds—more
than at any time since the 1930s. As related in Chapter 2, speculators in gold made
the same mistake three years later when, right at the top, they thought central banks’
massive gold buying was bullish.
You can apply the same approach to predicting reversals of fortune for
individuals who are public figures. Here is a quote from The Elliott Wave Theorist
from March 29, 1991:

157
On March 19th, Sony Corporation presented Michael Jackson the biggest
contract ever awarded an entertainer. It would be reasonable to assume that the
astounding value of the contract Mr. Jackson signed with Sony was a sign of a peak
in his valuation.
Here we ascribed meaning to the fact that one of the biggest corporations in the
world had decided to bet a billion dollars on a popular performer after he had had
years of outsized success. We thought, “This looks like an extreme in society’s
valuation of Mr. Jackson’s persona.” Shortly thereafter, his image turned negative
(see Figure 22), and Sony ended up rescinding its contract.
Figure 22
Four years earlier, I had come to a like conclusion about an approaching
reversal in my own public persona. Being socionomically aware made it possible to
recognize a professional peak as it happened and to brace myself for, and to temper,
the negative experience that lay just around the corner. (For details, see Prechter’s
Perspective, 1996.) Michael Jackson could have sidestepped a lot of pain had he
retired or gone on hiatus. Jerry Seinfeld did it right. Taylor Swift might want to take a
158
lesson. Socionomic thinking can provide real-time practical value to people who have
a publicly determined image.
An extreme in social passion is a sign of trend termination in all kinds of areas.
By 2007, increasing concern over man-made global warming had reached such a
point. Dramatic depictions of future climate conditions—exemplified by the famous
“hockey stick” graph—were based on extrapolations of recent trends not with a
modest straight line but with something akin to a parabola. In 2004, a disaster flick,
The Day after Tomorrow, presented an apocalyptic vision of the future due to man-
made global warming. In 2006, Al Gore’s Oscar-winning documentary, An
Inconvenient Truth, and the kid-oriented cartoon film, Ice Age: The Meltdown, were
in theaters. The scope of mass global-warming activities continued to expand into
April 2007, when the “Largest-Ever Rally Against Global Warming” took place. It
was one of the most intense episodes of public concern ever recorded absent the
threat of war. These manifestations prompted me to forecast in June and July 2007
that people in general would not be worrying about global warming to the same
degree in the future, if at all:
Advocates of man-made global warming may appear sober as judges
individually, but they are participating in a mass movement, involving press releases,
student rallies, pop concerts, movie documentaries and an underlying tone of moral
crusade…. There is powerful evidence of herding at the social level, and like all past
social trends that were ending, there is a rush to extrapolate. Hysteria often signals
the end of a trend.
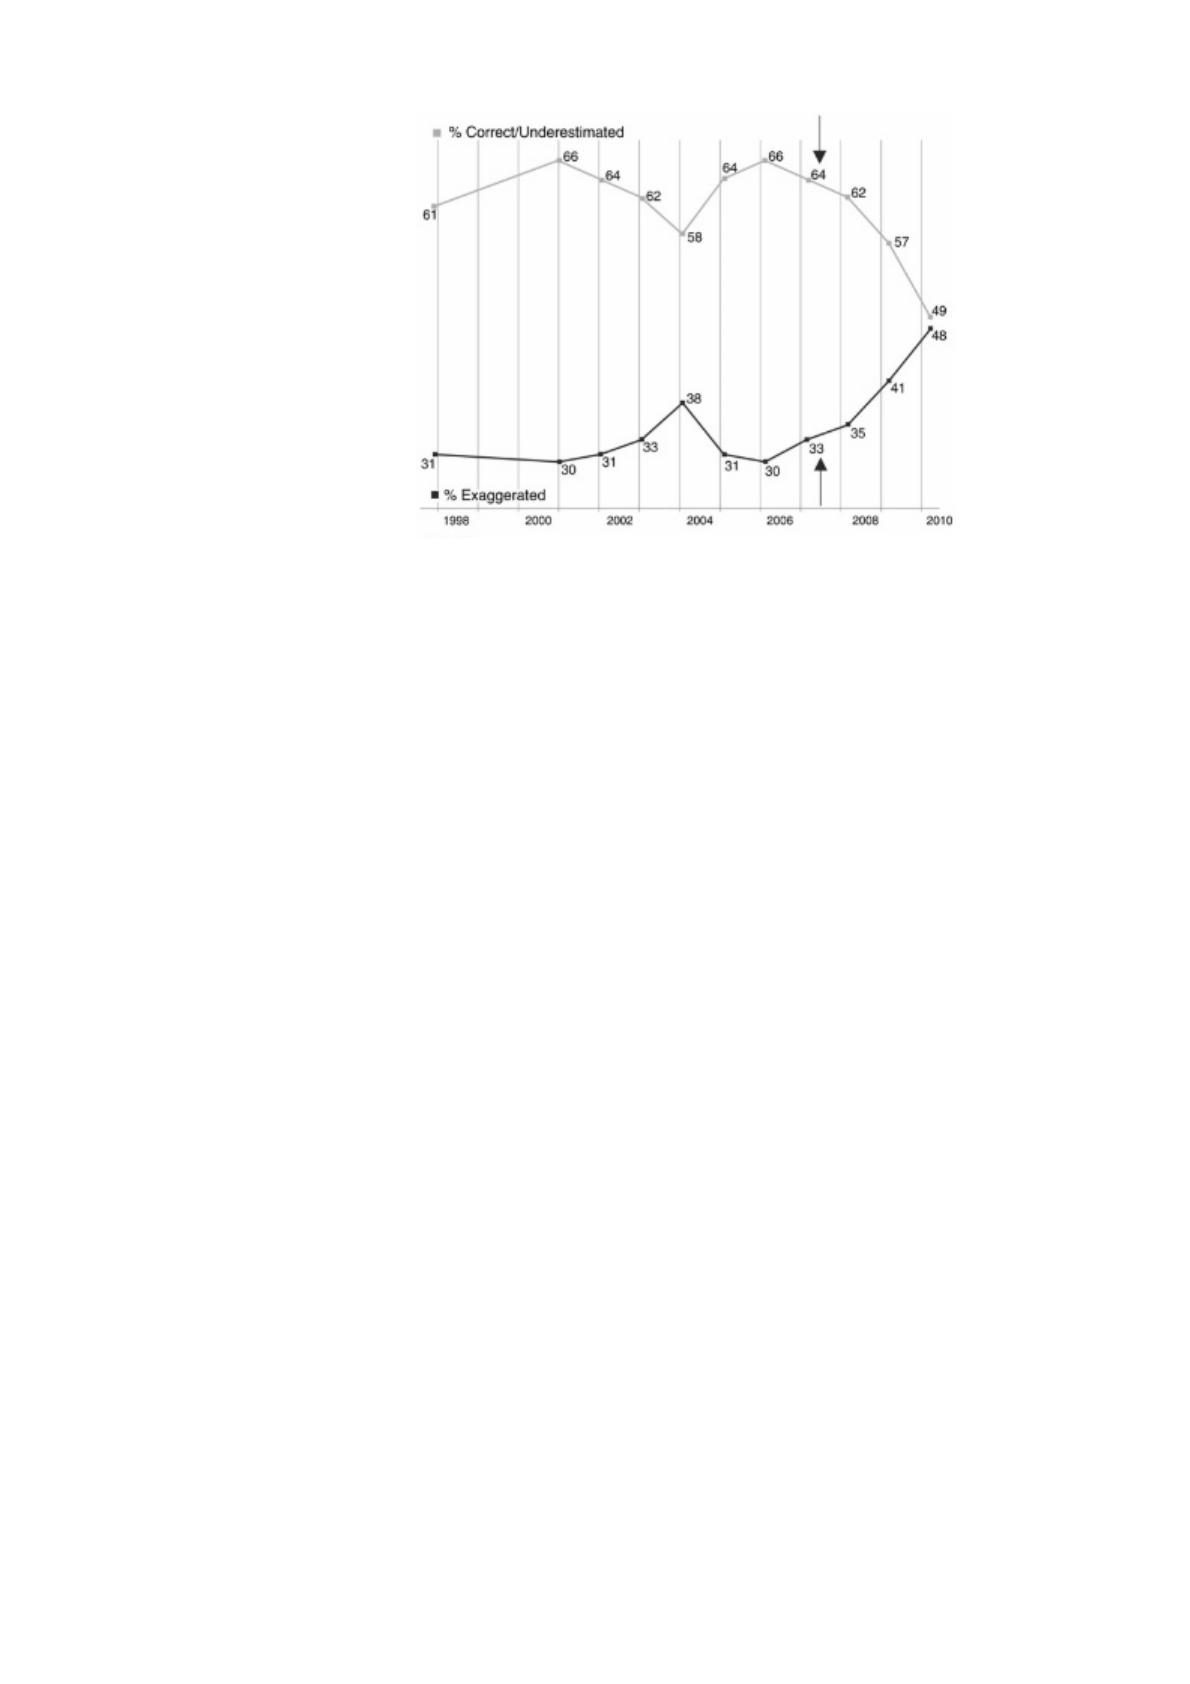
After issuing that analysis, I thought, “We need to get some data to see if this
forecast works out.” As it happens, the Gallup organization had created a specialized
sociometer by regularly asking people if they thought the global warming argument
was valid or understated vs. invalid or overstated. Figure 23 shows the data for ten
years prior to the forecast and three years thereafter. The arrows on the chart show
when I went to press.
159
Figure 23
A report from the Pew Research Center confirmed a thorough reversal of
public attitude. In its poll of Americans conducted in January 2013, the item titled
“dealing with global warming,” formerly the #1 concern, came in dead last in
people’s ranking of 21 issues on which government should focus its attention. I think
we can label that 2007 forecast a success.
I do not recall any futurist making this prediction. Economists and sociologists
typically wait until well after a trend has ended and then retrospectively come up with
an exogenous-cause explanation for its reversal. This time was no different. An
academic study from 2012 observed the decline in public interest over global
warming and proposed that it was “driven by the economic insecurity caused by the
Great Recession.” This is another “A caused B” mechanistic conclusion, which is not
only useless for forecasting but also wrong. The public’s passion over global
warming began receding in 2006 or early 2007, well ahead of the supposed cause,
negating the exogenous-cause argument. Though loosely tied to overall social mood,
the global-warming movement receded substantially on its own internal dynamics.
This is the only real-time socionomic analysis of a fad (referring to the cause as
opposed to climate science per se) featured in this book.
Extremes in social mood show up not only in projections for the future but also
in passionate assessments of present conditions. On December 18, 1964, after 32

160
years of rising real stock prices, President Lyndon Johnson declared, “These are the
most hopeful times in all the years since Christ was born in Bethlehem.” Fourteen
months later, the Dow/PPI started its deepest bear market since 1929-1932.
Conversely, on July 15, 1979, after 13 years of declining real stock prices and rising
inflation rates, President Jimmy Carter in a televised address memorably decried the
country’s “crisis of confidence…that strikes at the very heart and soul and spirit of
our national will.” Six months later, the Dow/gold ratio bottomed and took off on a
19-year run. The point is, you don’t need the stock market to glean analytical value
from public expressions of extremes in social mood.
The breadth of social mood’s influence can hardly be understated. It permeates
every area of social life. The extremity in positive mood that created the highest
stock-market valuations of all time in 1999 simultaneously created, for example, the
highest valuations for basketball franchises of all time. A retrospective analysis of the
sport from 2011 noted,
Owners in 1999 tolerated annual losses because so many were debt free and the
values of their franchises were skyrocketing. The more recent [around 2007] buyers
of NBA teams in some cases paid almost 20 times their predecessors—and in one
case 500 times—taking on debt when the growth in franchise values is slowing.”
This is essentially the equivalent of saying,
Tech-stock owners in 1999 tolerated dividend payouts of zero because the
values of their stocks were skyrocketing. The more recent buyers of stocks in 2007 in
some cases paid almost 20 times their predecessors—and in one case 500 times—
increasing their margin debt when the uptrend slowed.
Exactly the same psychology is involved in both cases: There was no thought
of losses or dividends, just dreams of capital gains. The ultimate result was the same,
too. Stock owners suffered huge losses in 2008-2009, and team owners “contend they
lost a combined $300 million” in the 2010-2011 season.
So, even if you are unfamiliar with the Elliott wave model and do not follow
the stock market, you can make useful forecasts simply by being attuned to extremes
in social sentiment.
161
Socionomic Prediction is Counter-Intuitive
As this chapter shows, socionomists interpret the news in a way diametrically
opposed to the way everyone else does. When we read that experts at a think tank
have predicted rising energy prices for the next decade, we figure that energy prices
are probably near a top. When we read that economists agree that a recession is in
force, we see it as evidence that a recession is about over. And so on. By the time
conditions, events and commentaries fully reflect a positive or negative mood trend
of a particular degree, they can have predictive value in the opposite direction. Even
absent detailed application of the Elliott wave model, such conclusions essentially
derive not from linear extrapolation but from fractal extrapolation. Adopting such a
mindset will set you far apart from the crowd.
Limits to Sentiment-Only Contrarianism
The unbounded nature of social mood fluctuations can make the bounded
nature of most sentiment indicators problematic to forecasting. When waves of
extremely high degree are in their late stages, bounded readings of optimism or
pessimism can stay pinned near maximum levels for a long time. A striking example
of this condition occurred from 1998 to 2007, as explained in the October 19, 2007
issue of The Elliott Wave Theorist:
Optimism in the Stock Market
The latest reading from Investors Intelligence shows 62% bulls among
newsletter advisors, the second-highest reading over the past 21 years, a period that
includes the tops of 1987 and 2000. And this is not the most extreme figure relating
to investor sentiment. The duration of net optimism is the longest ever by many
measures.
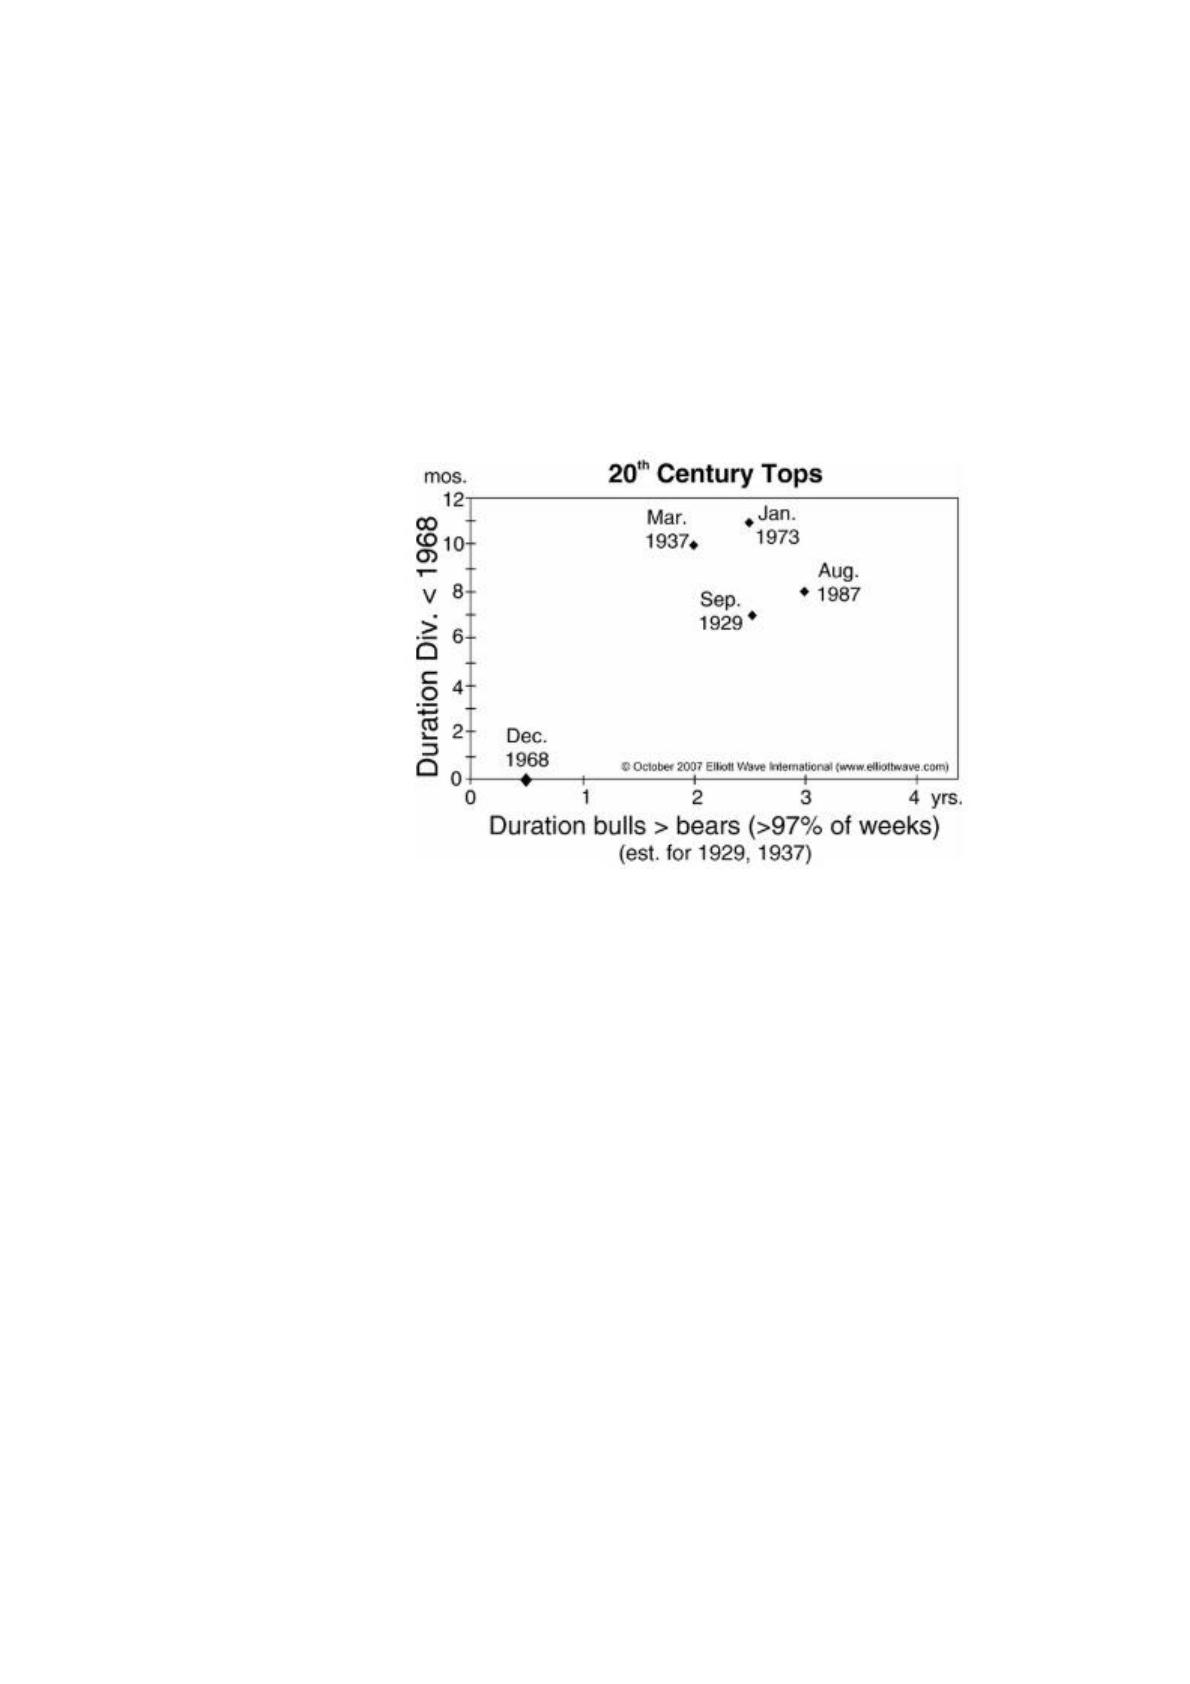
Figure [24] shows how the greatest tops of the 20th century compare on this
basis. The X axis records the length of time that bulls consistently outnumbered bears
for at least 50 out of 52 weeks in Investors Intelligence’s weekly readings. (I estimate
162
that at the tops in 1929 and 1937, bulls outnumbered bears continuously for about 2-
2.5 years.) The Y axis records the length of time that the dividend yield from the
Dow was less than it was at the 1968 top, the peak with the highest dividend payout
among these five tops. As you can see, the other major tops cluster around an area of
2-3 years for a lopsided bullish consensus and only 7-11 months for extremely low
dividend payout.
Figure 24
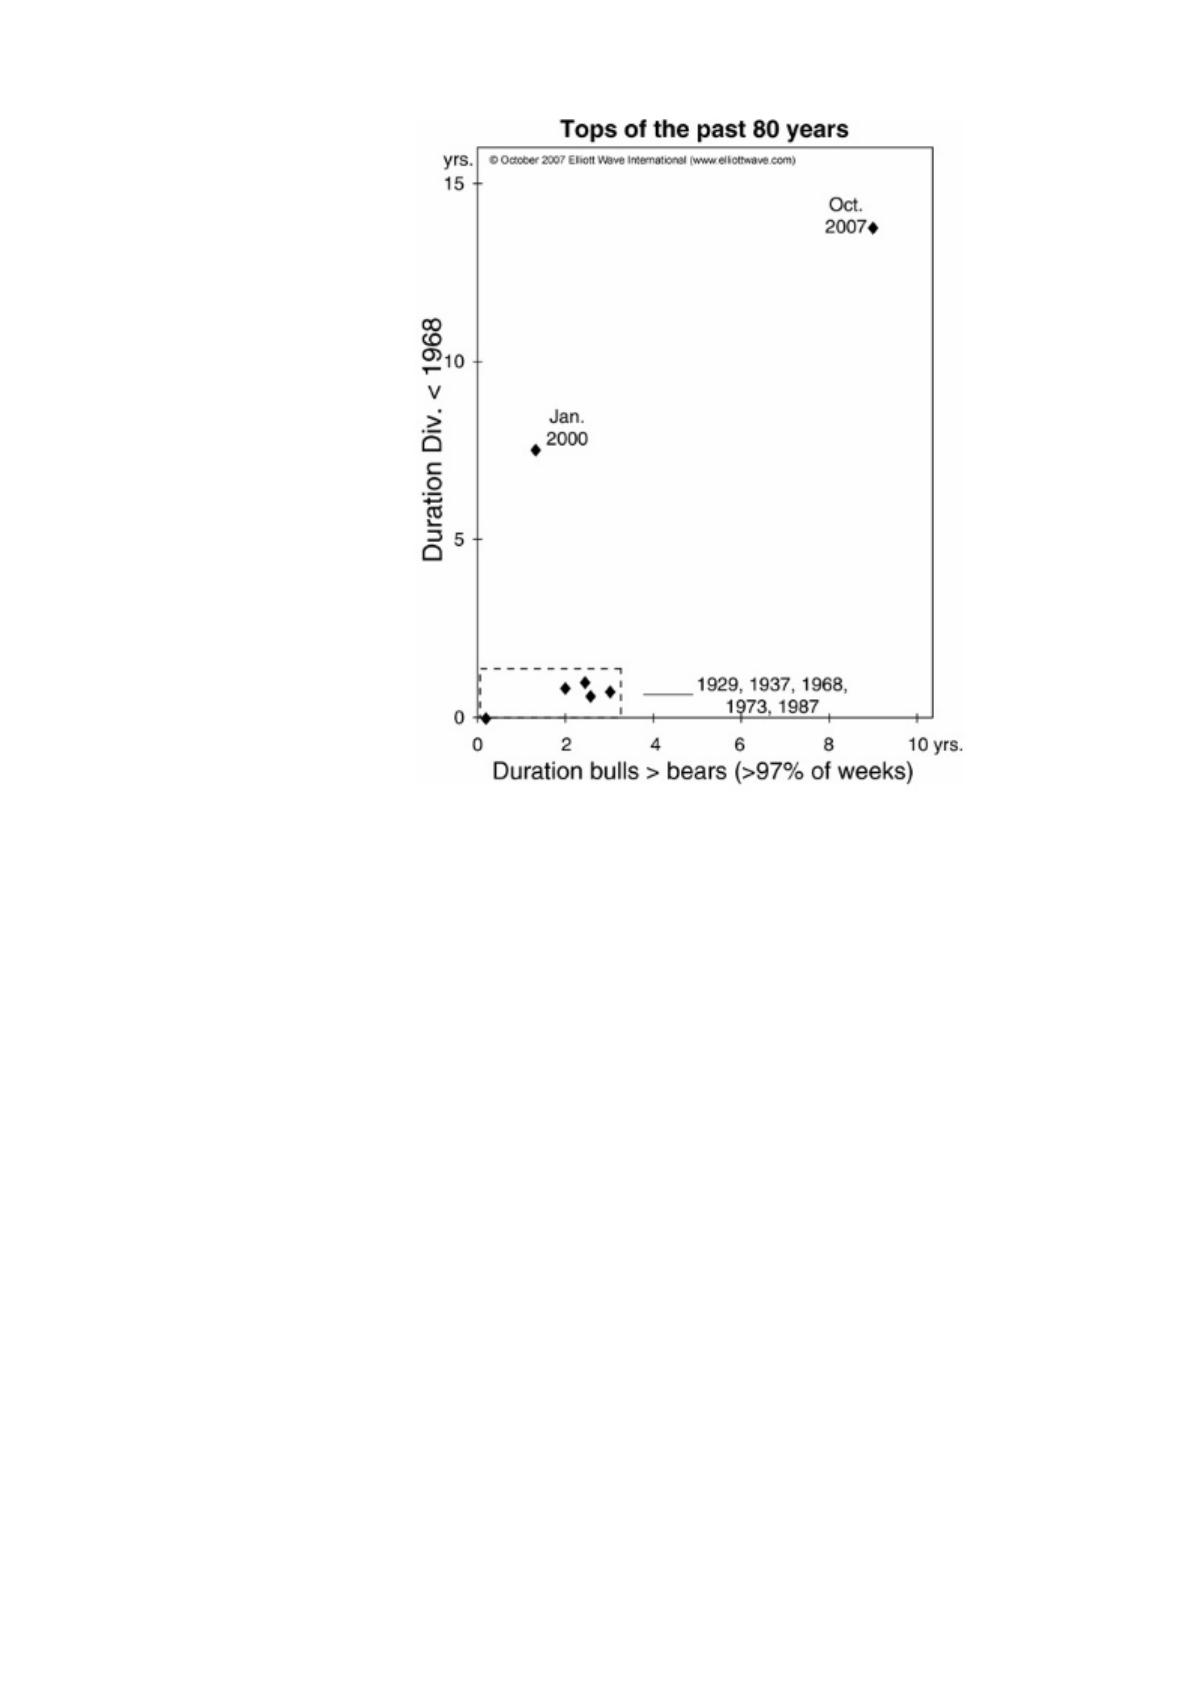
Now look at Figure [25]. This is the same graph but with two added data points
representing the top of January 2000 and now. Compared to past market tops, the
current juncture is nothing less than grotesque.
163
Figure 25
Let’s use the peak reading of 1929, the greatest top of the 19th and 20th
centuries, as a benchmark. At the 1987 high, bulls had reigned for three years, but
just three months after the annual dividend yield from the DJIA fell below that of
1929, the market crashed. At the 2000 high, dividends had been below the 1929 level
for a full six years, but the duration for a preponderance of bulls was only 1.25 years.
That was enough for the S&P to fall in half and the NASDAQ to collapse 78%.
Here in October 2007, advisory bulls have consistently outnumbered bears for
9 years, by an incredible 51/52 ratio of weekly readings, and the dividend yield has
been below that of 1929 for 13 years. Thus, optimism is not only historically extreme
in terms of extent but also—by a huge amount—in duration, dwarfing all previous
experiences.
The condition described above had been troublesome, because it had kept me
persistently bearish and wrong throughout the 2003-2007 intra-correction (B-wave)
rally. The implication of these readings nevertheless prevented me from throwing in