134
A sensible model must incorporate continual change naturally. Thankfully,
there is a whole new way of looking at the idea of extrapolation.
Extrapolating Social Trends Using a Fractal Model
To explain and predict social change, socionomic theory rejects the paradigm
of linear progression and exogenous disruption and replaces it with fractal
progression and endogenous consistency. Instead of extrapolating straight lines,
Elliotticians extrapolate a different form: a robust, self-affine, hierarchical fractal
called the Wave Principle. Briefly stated, Elliotticians extrapolate Elliott waves.
The Elliott wave model has an 80-year history of useful application. By its very
nature it incorporates both trends and trend changes, at all wave degrees. It applies to
financial-market herding and even more crucially to social mood and its immediate
consequences in social action.
By orienting to a fractal form rather than a straight line, Elliotticians and
socionomists have a method of anticipating change before any hint of the new trend
is manifest. When others are at peak excitement to extrapolate linearly, we are at
peak excitement to extrapolate a turn in the other direction. It is a completely
different mindset.
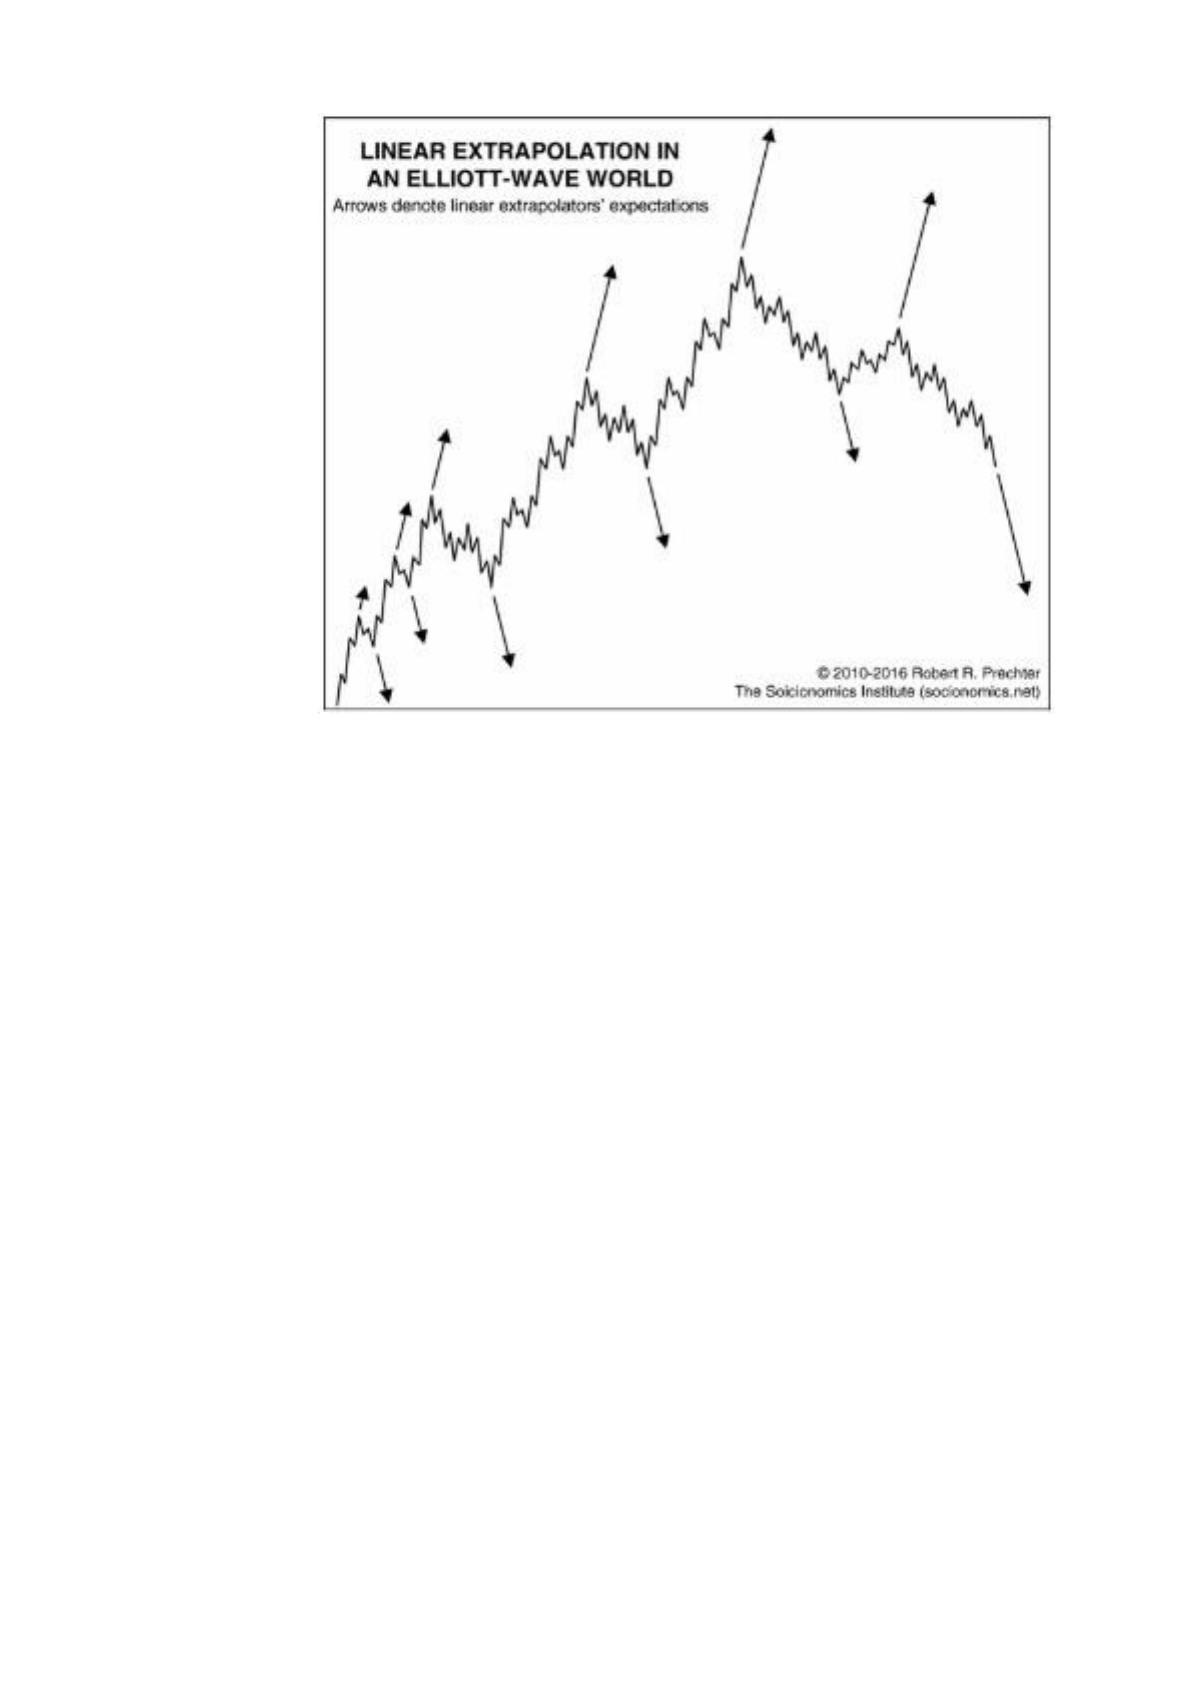
Figure 2 depicts the fractal movements of the stock market as described by an
idealized version of the Elliott wave model. The arrows show how conventional
futurists approach forecasting. Because they project trends linearly, they are most
convinced of an old trend’s continuation at the very time when waves at several
degrees of trend are culminating. The longer and further a trend has gone in the same
direction, the stronger are futurists’ expectations that it will continue, as depicted by
the longer arrows. In between the points where the arrows are, their opinions morph
from the direction of the first arrow to the direction of the second. The socionomic
approach to social prediction incorporates this fractal model, so for us (ideally) the
arrows go in the opposite direction.
135
Figure 2
A fractal model is not a panacea. It can dispose a futurist to look for too many
turns. Being patient while an Elliott wave plays out can be challenging for a mind
bent on looking for evidence of change. But at least Elliotticians are not doomed to
miss every turn. They may be early or late, but they are not inevitably, pathologically
late, as linear extrapolators are.
Intimate knowledge of the Elliott wave model greatly enhances one’s ability to
forecast the social future. Nevertheless, an analyst can apply socionomic thinking
without employing EW. As outlined in Chapter 7, there are five bases for socionomic
forecasting. The rest of this chapter covers five subsets of those approaches. Only the
first two methods require detailed knowledge of the Elliott wave model. The rest of
them do not. We will review each of these methods in turn.
(1) Extrapolating Trends Using the Elliott Wave Model
Chapter 22 details over two decades of Elliott-wave-based forecasts for the
price of a representative of the commodity markets, oil. This section augments that
history with a pair of examples—out of hundreds available—representing two other
types of markets: individual stocks and currencies.

136
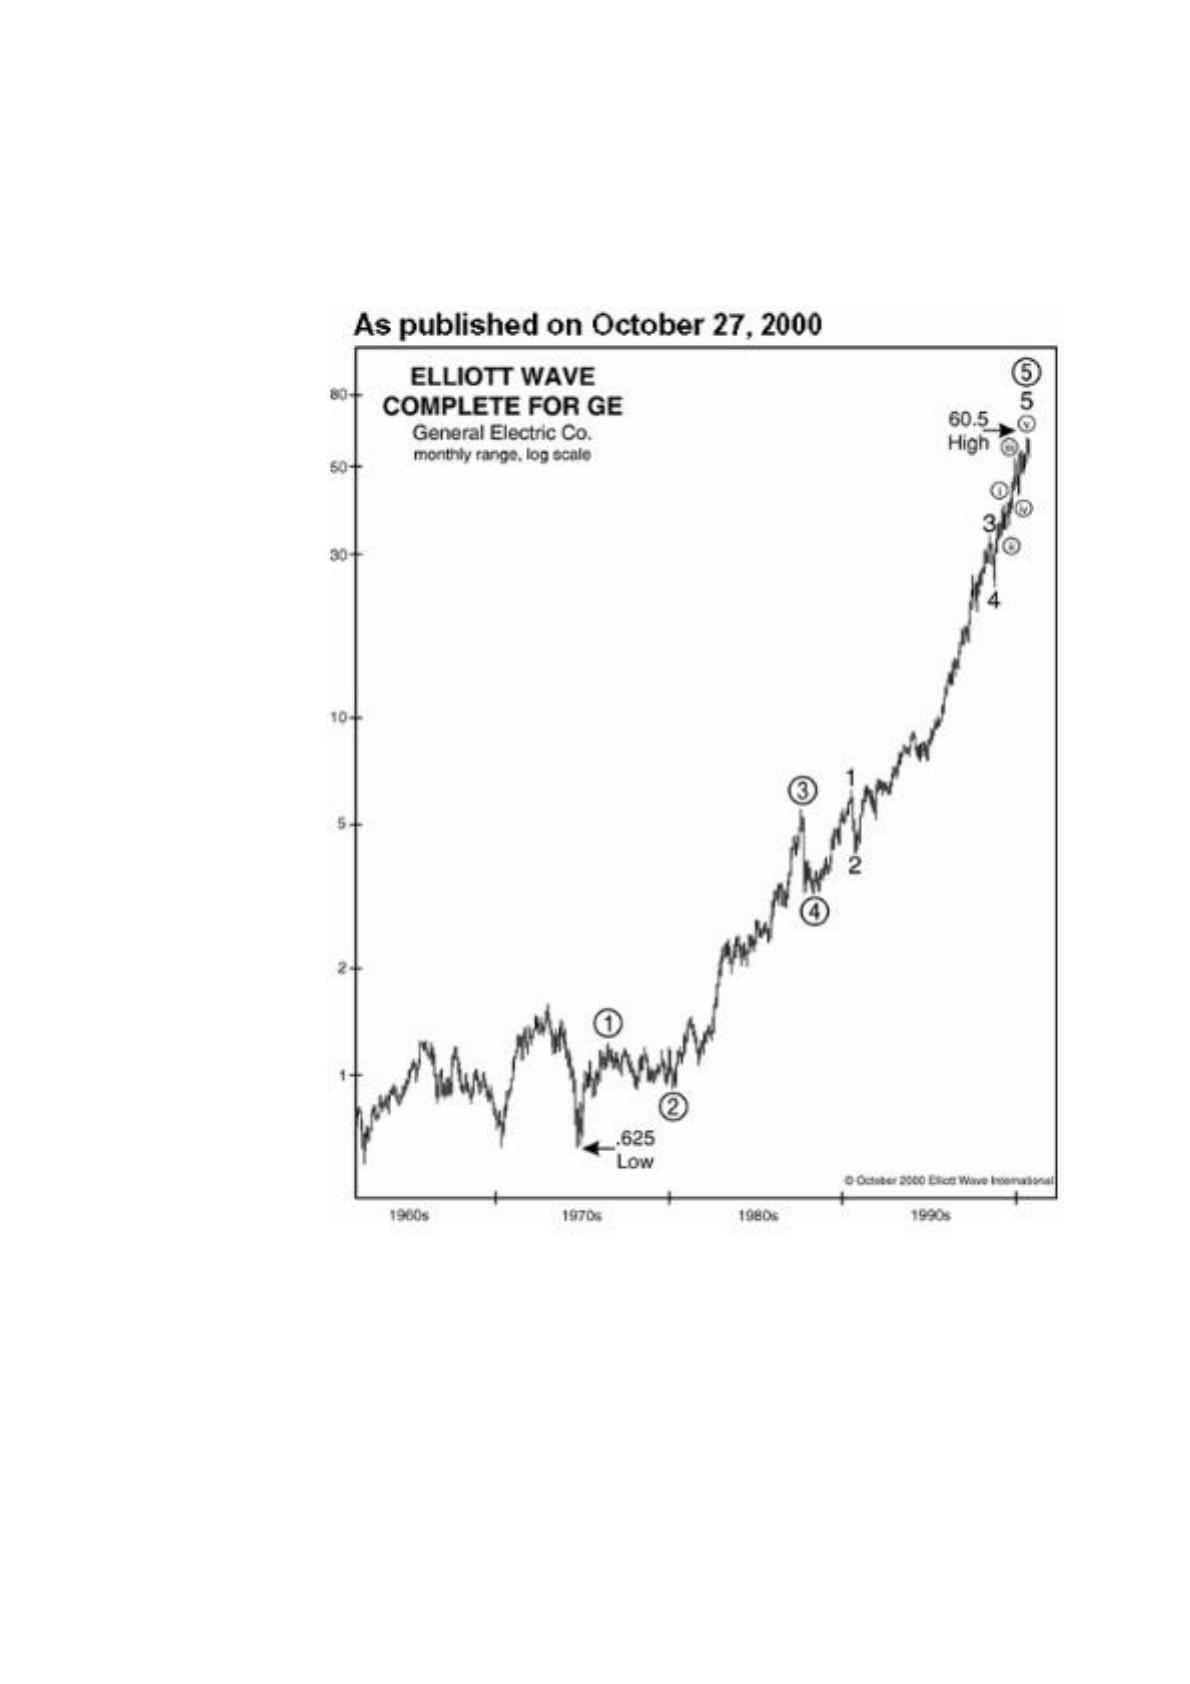
On October 27, 2000, Steven Hochberg and Peter Kendall, who write The
Elliott Wave Financial Forecast, published Figure 3, showing a completed Elliott
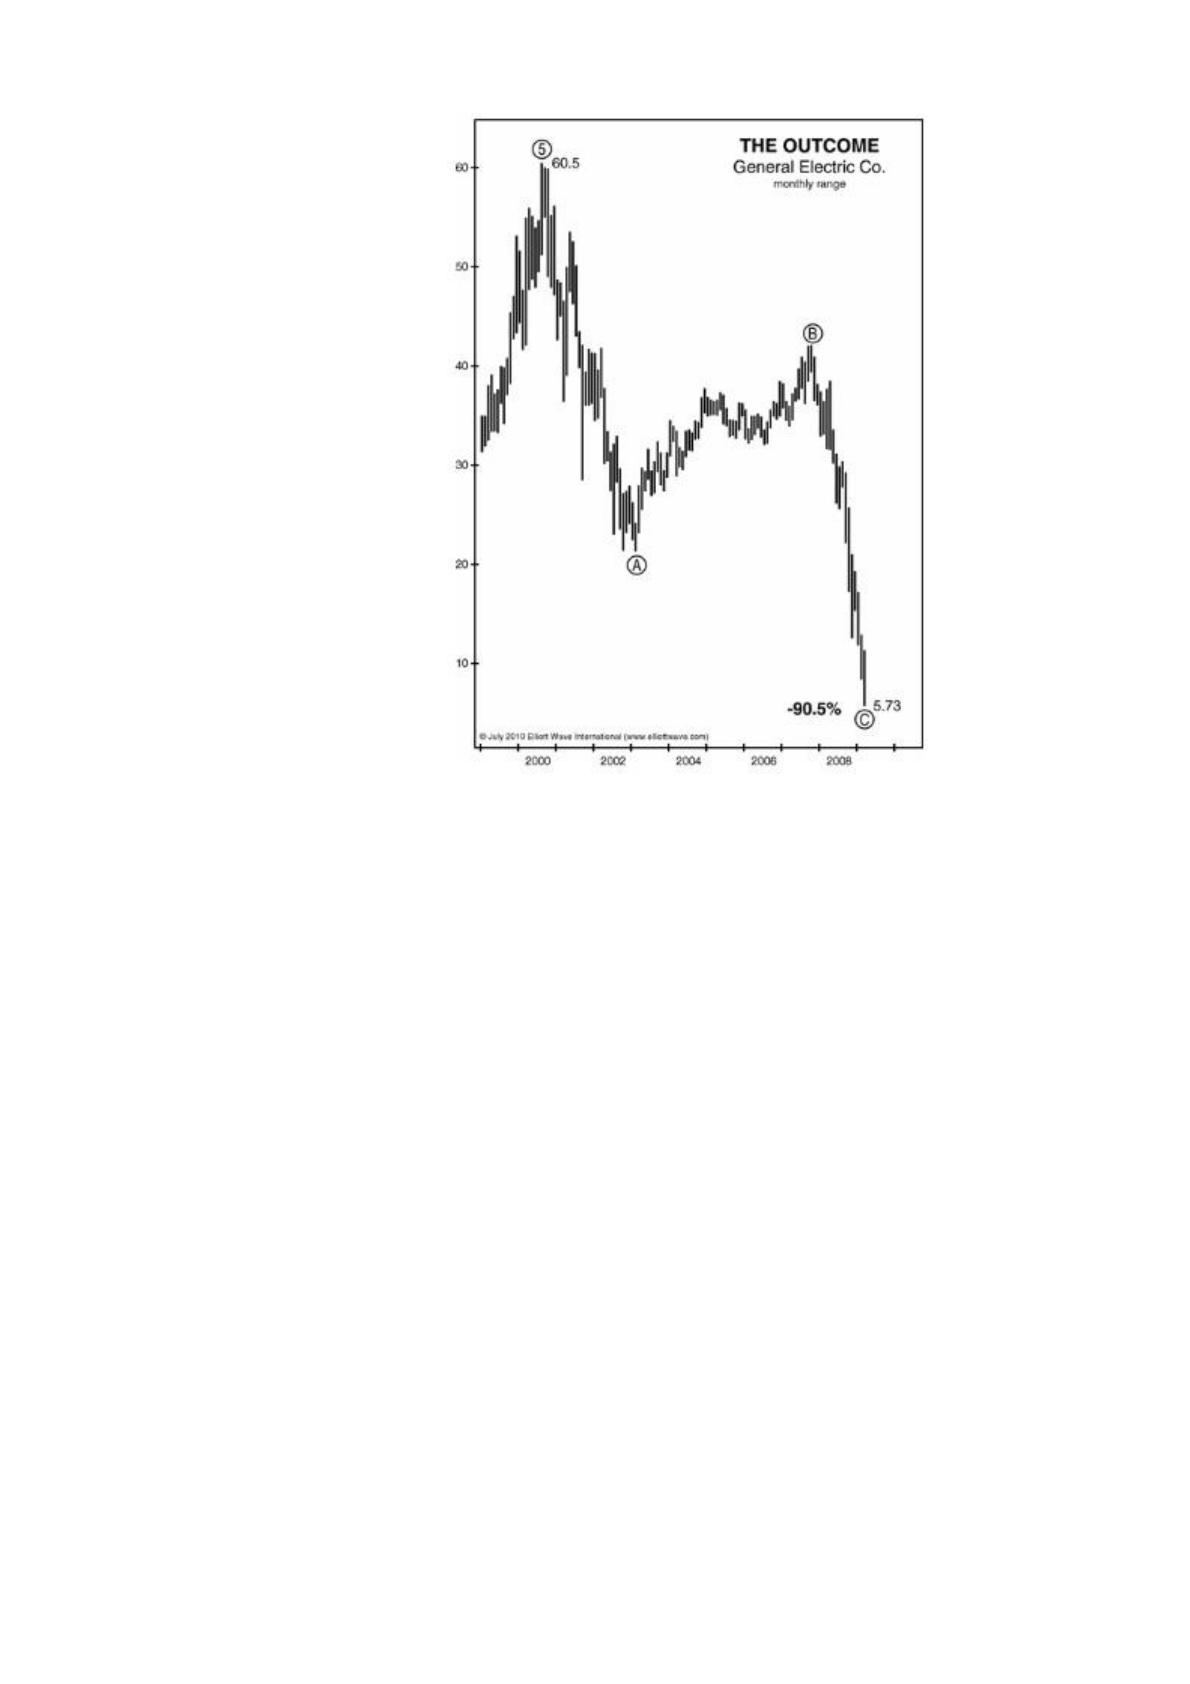
wave in GE stock. This quarter-century pattern portended a major reversal. Figure 4
shows what happened thereafter.
Figure 3
137
Figure 4
Observations such as this are valuable beyond investing. The CEO of General
Electric might have made some different decisions, for example to get his company
out of the finance business. Or, he might have resigned at the top and gone out in
glory.
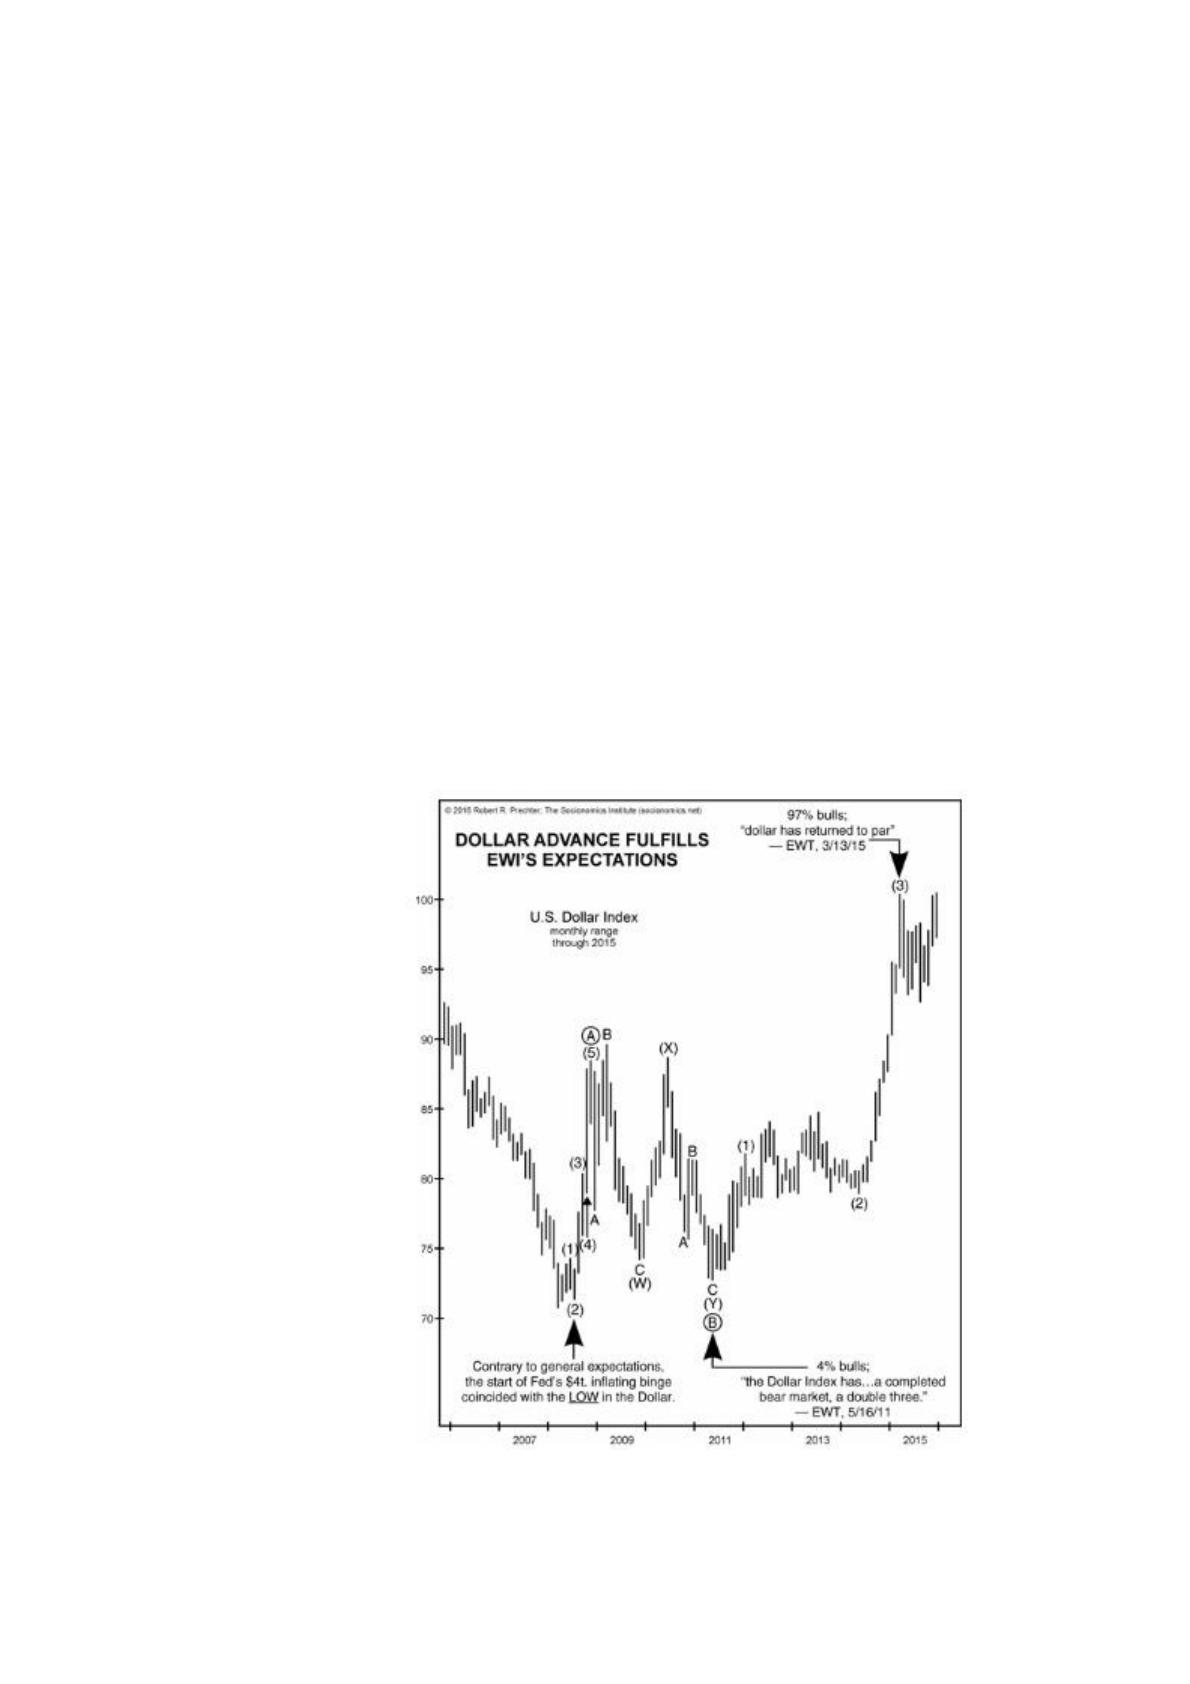
The Elliott wave model is useful for predicting currency values, too. The U.S.
dollar had fallen a long way against other currencies during most of the decade of the
2000s. At each of the major lows of 2008, 2009 and 2011, the media and the Internet
were awash in commentaries on the demise of the dollar. In one of the most delicious
of ironies, the Dollar Index—which prices the dollar against a basket of other
currencies—bottomed in March 2008, six months before the Federal Reserve began
its policy of creating four trillion new dollars through multiple “quantitative easing”
programs (see Chapter 2). Utterly ignoring these supposedly bearish exogenous-cause
“fundamentals,” the Dollar Index held above its 2008 low during the entire period of
historic QE inflating. Speculators holding inflation-hedge investments were
mystified. They were sure the Fed’s actions were exogenous forces that would drive
138
the dollar lower and foreign currencies higher. Socionomics, as usual, reverses the
causality: The onset of declines in financial markets and the economy drove the Fed
to adopt a QE policy. That is the only causality that makes sense of the data.
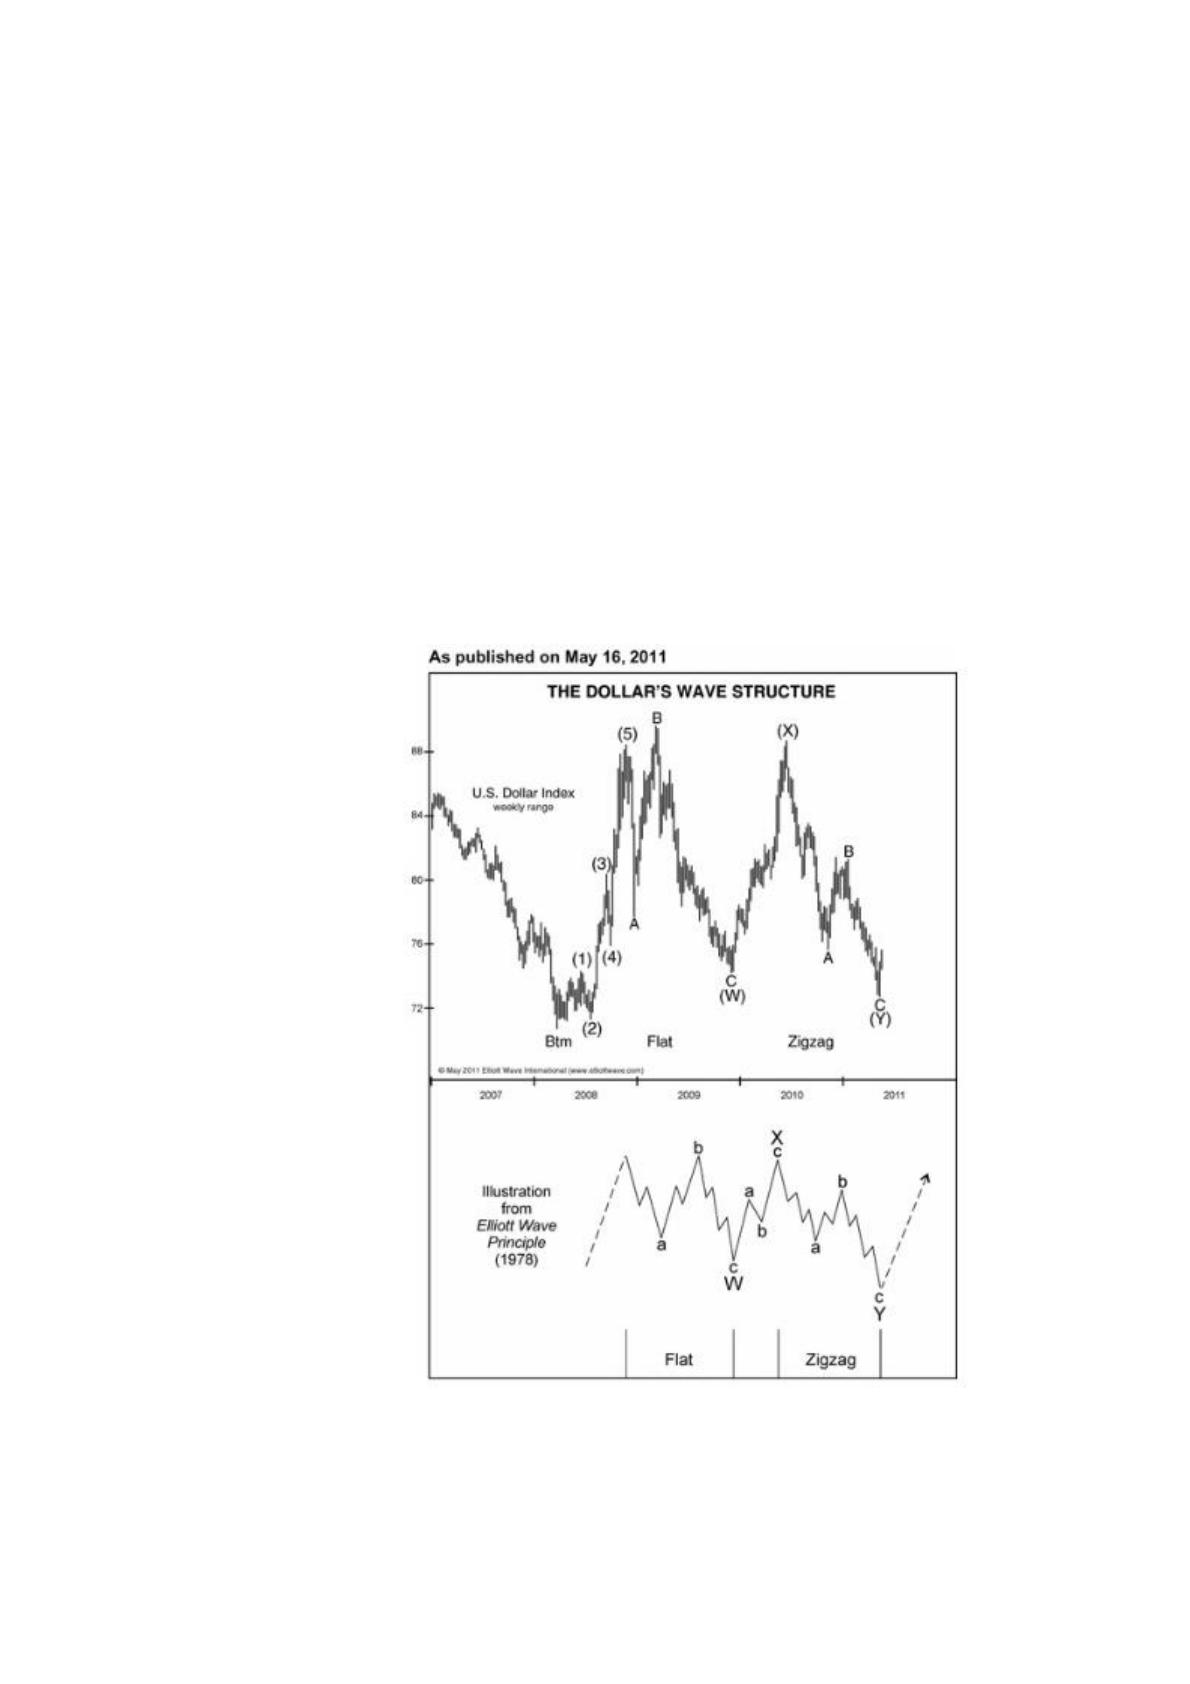
On May 16, 2011, QE was poised to accelerate at a historic rate with no
scheduled time limit, and the Daily Sentiment Index was recording percentages of
bulls among Dollar-Index futures traders as low as 4%. That’s when The Elliott Wave
Theorist published Figure 5 and the following commentary:
The chart shows the wave labeling for a completed bear market, a double three,
labeled as a flat-X-zigzag along the lines of Figure 1-48 from Elliott Wave Principle,
reproduced here. I think the dollar is starting a five-year bull market, which will
coincide with a bear market in everything else.
Figure 5
Thereafter the Dollar Index took off on the upside, while commodities,
precious metals and foreign currencies fell to the point of making headlines.
139
By March 2015, the Dollar Index had risen from 70.70 to 100.39, a gain of
42%. The Daily Sentiment Index reported readings of 98% bulls among Dollar Index
traders on January 5, 2015, 96% on March 9 and 97% on March 10 and 11. The
crowd that had hated the dollar now loved it. On March 13, the day of the high that
month, The Elliott Wave Theorist issued the following assessment:
It was a long time coming, but the U.S. Dollar Index—in line with our
forecast—has finally returned to par. After slipping as low as 70.70 in March 2008, it
hit 100.39 today. The latest surge has been the fastest one-year rise in the Dollar
Index since the early 1980s. The Dollar Index debuted at par in 1973. After a wild 42
years, it’s back where it started.
Figure 6 places the bullish pattern identified in 2011 within a larger context. As
of the close of 2015, the forecasted five years of rise—as opposed to, say, five weeks
or five months—appears to have been a fairly good estimate of the dollar’s potential
at the low of 2011. How waves (4) and (5) resolve remains to be seen.
Figure 6

140
(2) An Elliott-Wave-Based Stock Market Outlook Implies Changes in
Other Financial and Social Trends
If you can predict changes in stock market patterns using the Elliott wave
model, you can predict the tenor and character of many other types of social-mood
expression. Conventional economists and futurists try to forecast such things, too, but
their tool is a straight line. Let’s contrast the two approaches.
From 1966 to 1982, the nominal stock market went sideways (see Figure 7),
while inflation-adjusted measures such as Dow/PPI and S&P/PPI (see Figure 4 in
Chapter 10 and Figure 8 in Chapter 12, respectively), were going down throughout
that period. Toward the end of that trend, what kind of books do you think people
wrote? Would they tell you that a financial and economic boom lay directly ahead?
No. They linearly extrapolated the aging downtrend and put out all kinds of bearish
books, 20 of which are displayed in Figure 8 along with a bullish outlier, Elliott Wave
Principle. What all these bearish futuristic books actually expressed was the present
social mood, which was negative.
Figure 7

141
Figure 8
The image at the bottom right of Figure 8 shows the cover of a magazine called
The Futurist. The headline at the bottom says, “The Great Depression of the 1980s:
Could it Really Happen?” It would have happened if trends followed straight lines.
But in the real world of fractal change, the opposite outcome occurred.
About that time, two Elliott wave analysts went about the same task of
projection using a fractal model. In 1978, A.J. Frost and I wrote Elliott Wave
Principle, which called for a 1920s-style boom. That’s not extrapolating a straight
line; that’s looking around the corner. On October 6, 1982, as the boom began, The
142
Elliott Wave Theorist made its first socionomic forecast, calling for “No international
war for at least ten years.” Regarding the economy, the November 8 issue announced,
“Recovery Beginning.” The March 1983 issue called for an “Economic Boom” and
advised, “Don’t build bomb shelters. This is a time to focus on finance, expand your
business or promote your career.” This conclusion followed from the assessment
based on the Elliott wave model that social mood had just begun a positive trend of
major degree. The wave-based forecast for a rising stock market implied prosperous
and peaceful social conditions as well.
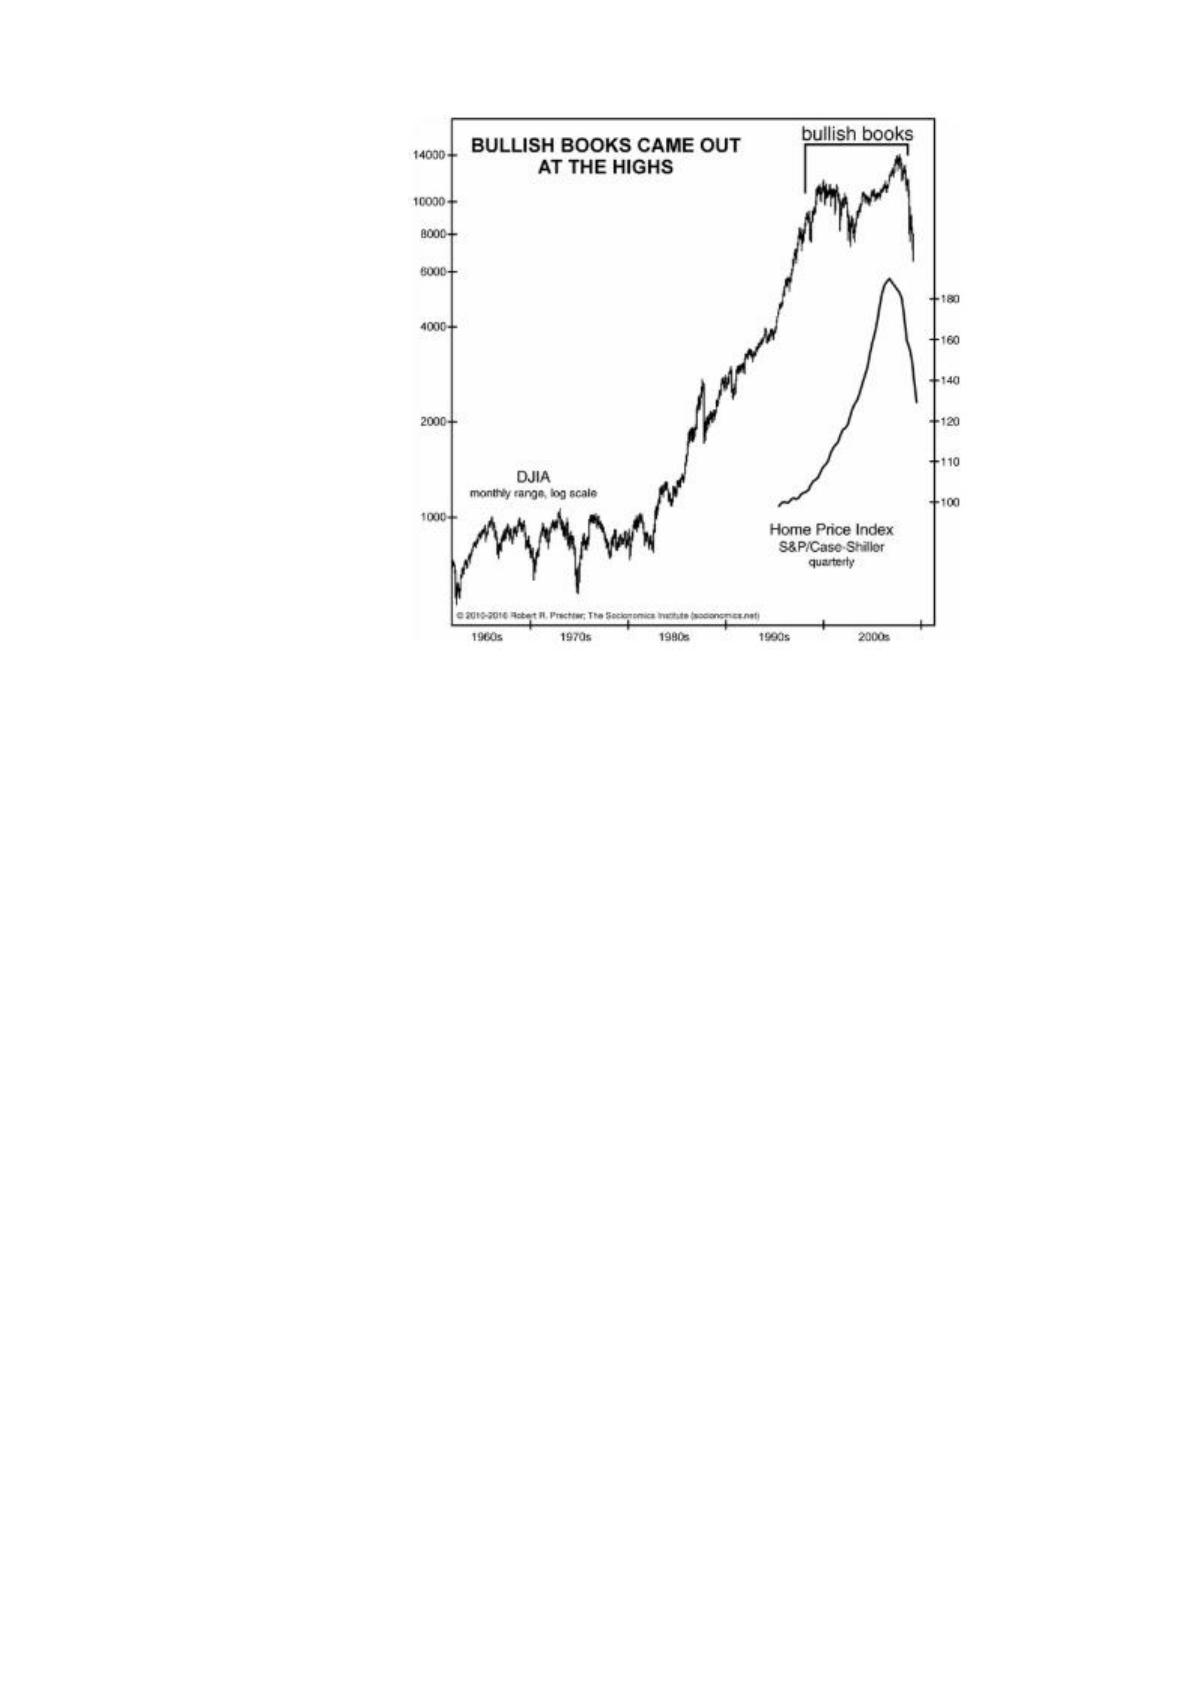
Let’s look at the other end of the trend (see Figure 9). What kind of books did
people write between 1998 and 2007, a period of historically extreme positive mood?
Would authors tell you, “This is a great time to sell; stocks are overpriced, and
property is at the peak of a debt-fueled bubble”? Of course not. Optimism permeated
almost everyone’s thinking, and their forecasts reflected it. Figure 11 shows 36 super-
bullish titles that came out between 1998, when the Value Line Composite index
made its all-time high for the era, and 2008, two years after real estate made its all-
time high and a few months after the Dow and S&P topped. On the left side are the
stock-market titles, with forecasts ranging from Dow 36,000 to Dow 100,000. At the
time, EWI’s Kendall called these and 30 new books on day-trading “an odd
combination of dangerous and laughable.” On the right side are the real estate titles,
including Two Years to a Million in Real Estate and Real Estate Debt Can Make You
Rich. Reviewing that time years later, a financial columnist listed ten public forecasts
for the Dow made in and around 1999; linear extrapolations all, they ranged from
15,000 to 700,000. All these optimistic forecasts were products of a positive extreme
in social mood.
143
Figure 9
We at Elliott Wave International were almost apoplectic looking at the extent
of financial optimism during this period. Two years into the nine-year bear market, I
got the nerve to put out a book called Conquer the Crash (shown in Figure 10). Its
outlook wasn’t (yet?) entirely accurate, but it saw dangers the other books didn’t. It
identified the conditions of a major stock market peak and forecast a debt crisis,
based on socionomic causality: A positive mood trend had allowed incautious people
to expand credits and debts to an extreme level, and negative mood would reverse
that trend. The book called for a major decline in real estate prices at a time when the
world believed that property was a fail-safe investment. It singled out the Federal
National Mortgage Corporation (Fannie Mae) as a pending disaster. In the same
month, Steven Hochberg and Peter Kendall of The Elliott Wave Financial Forecast
added that Fannie Mae would get the “worst of the downturn” (see Figure 11). At that
time, every mutual fund owned Fannie Mae stock. Investors figured that since Fannie
Mae was a government-sponsored enterprise dedicated to financing the American
dream and had been a staple of political promises for decades, it would never be
allowed to implode. But it did implode, and the stock went virtually to zero, as shown
in Figure 12. That’s the kind of prediction you can make when you have a