144
socionomic mindset and pay attention to what areas should be most affected by a
change in social mood.
Figure 10
145
Figure 11
Figure 12

146
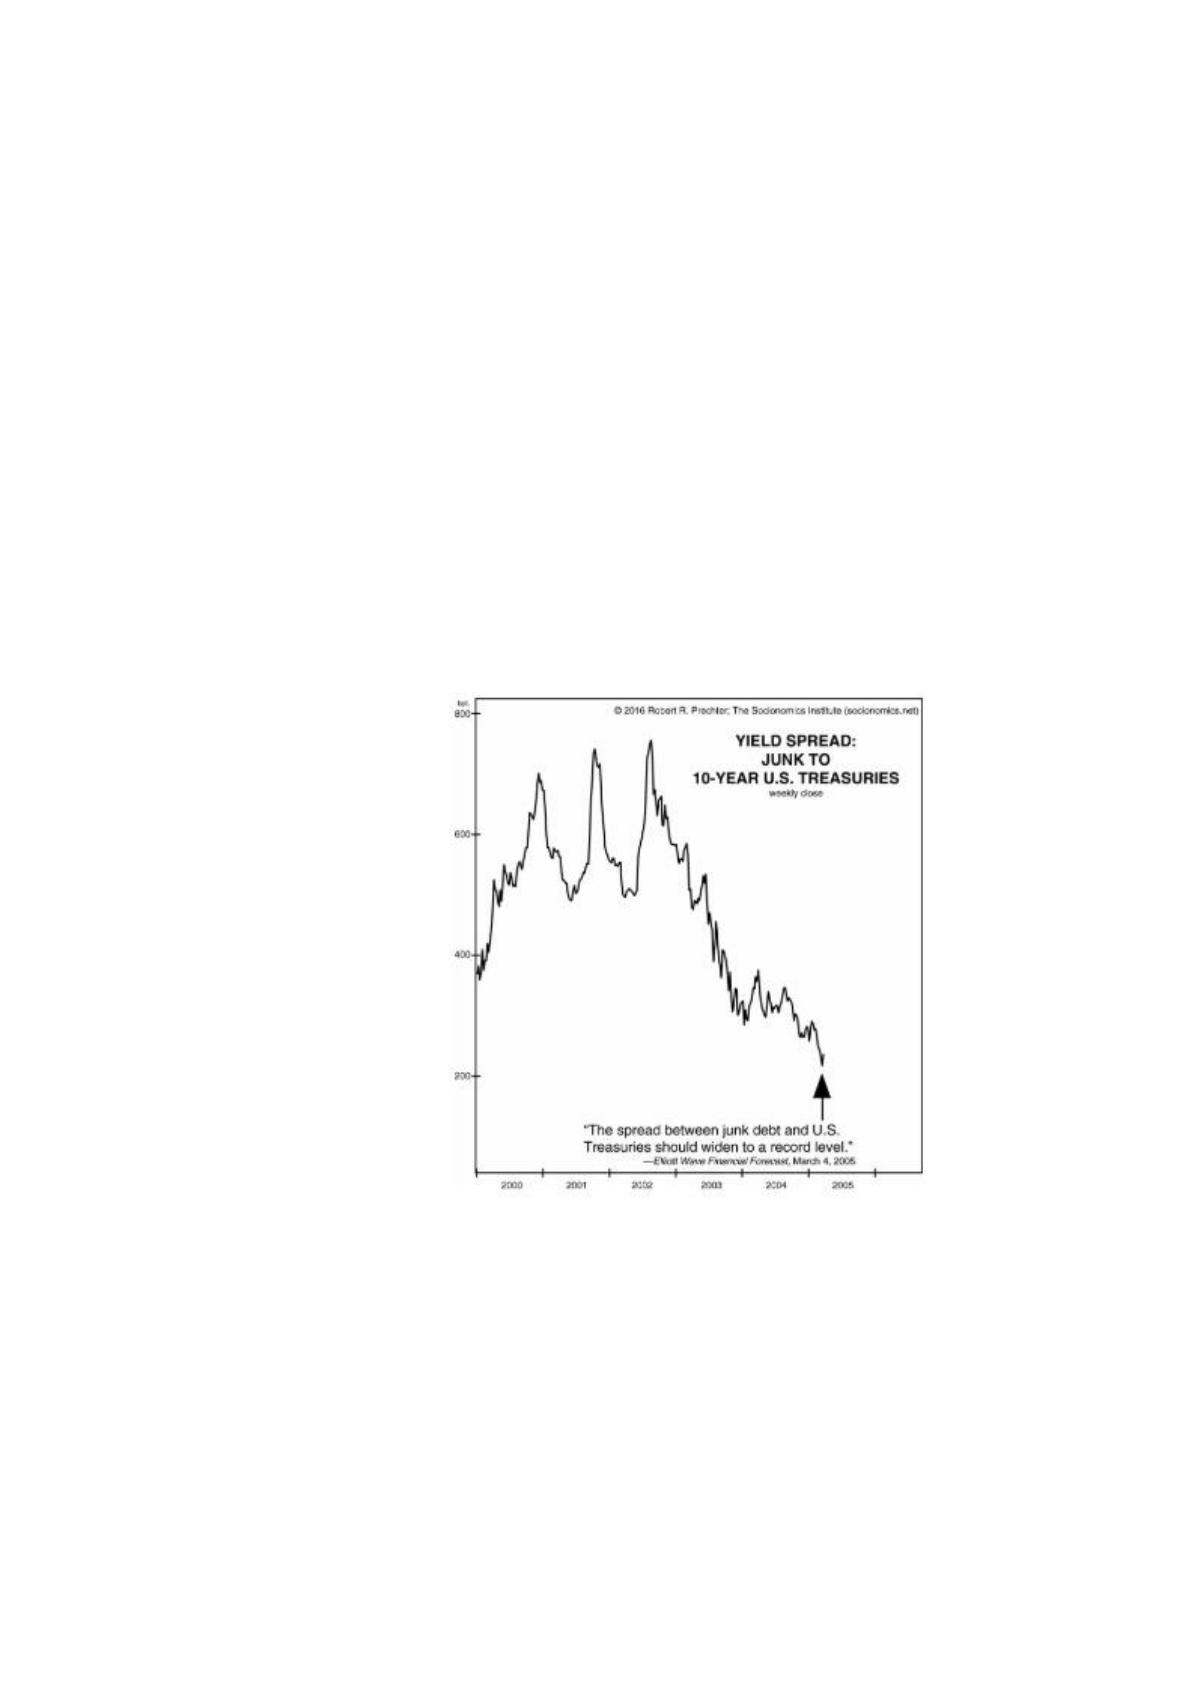
The extreme optimism of 2005 also prompted complacent investors to narrow
the yield spread between junk bonds and 10-year U.S. Treasury notes. On March 4,
2005, Hochberg and Kendall in The Elliott Wave Financial Forecast published
Figure 13 and stated, “If we were forced to make just one statement with respect to
bonds for the rest of the bear market, it would be this: The yield spread between junk
debt and U.S. Treasuries should widen to a record level. If you play that spread now,
you’ll probably make a lot of money.” This outlook seemed crazy, because there was
nothing in the “fundamentals” to worry about; the economy was in recovery, and
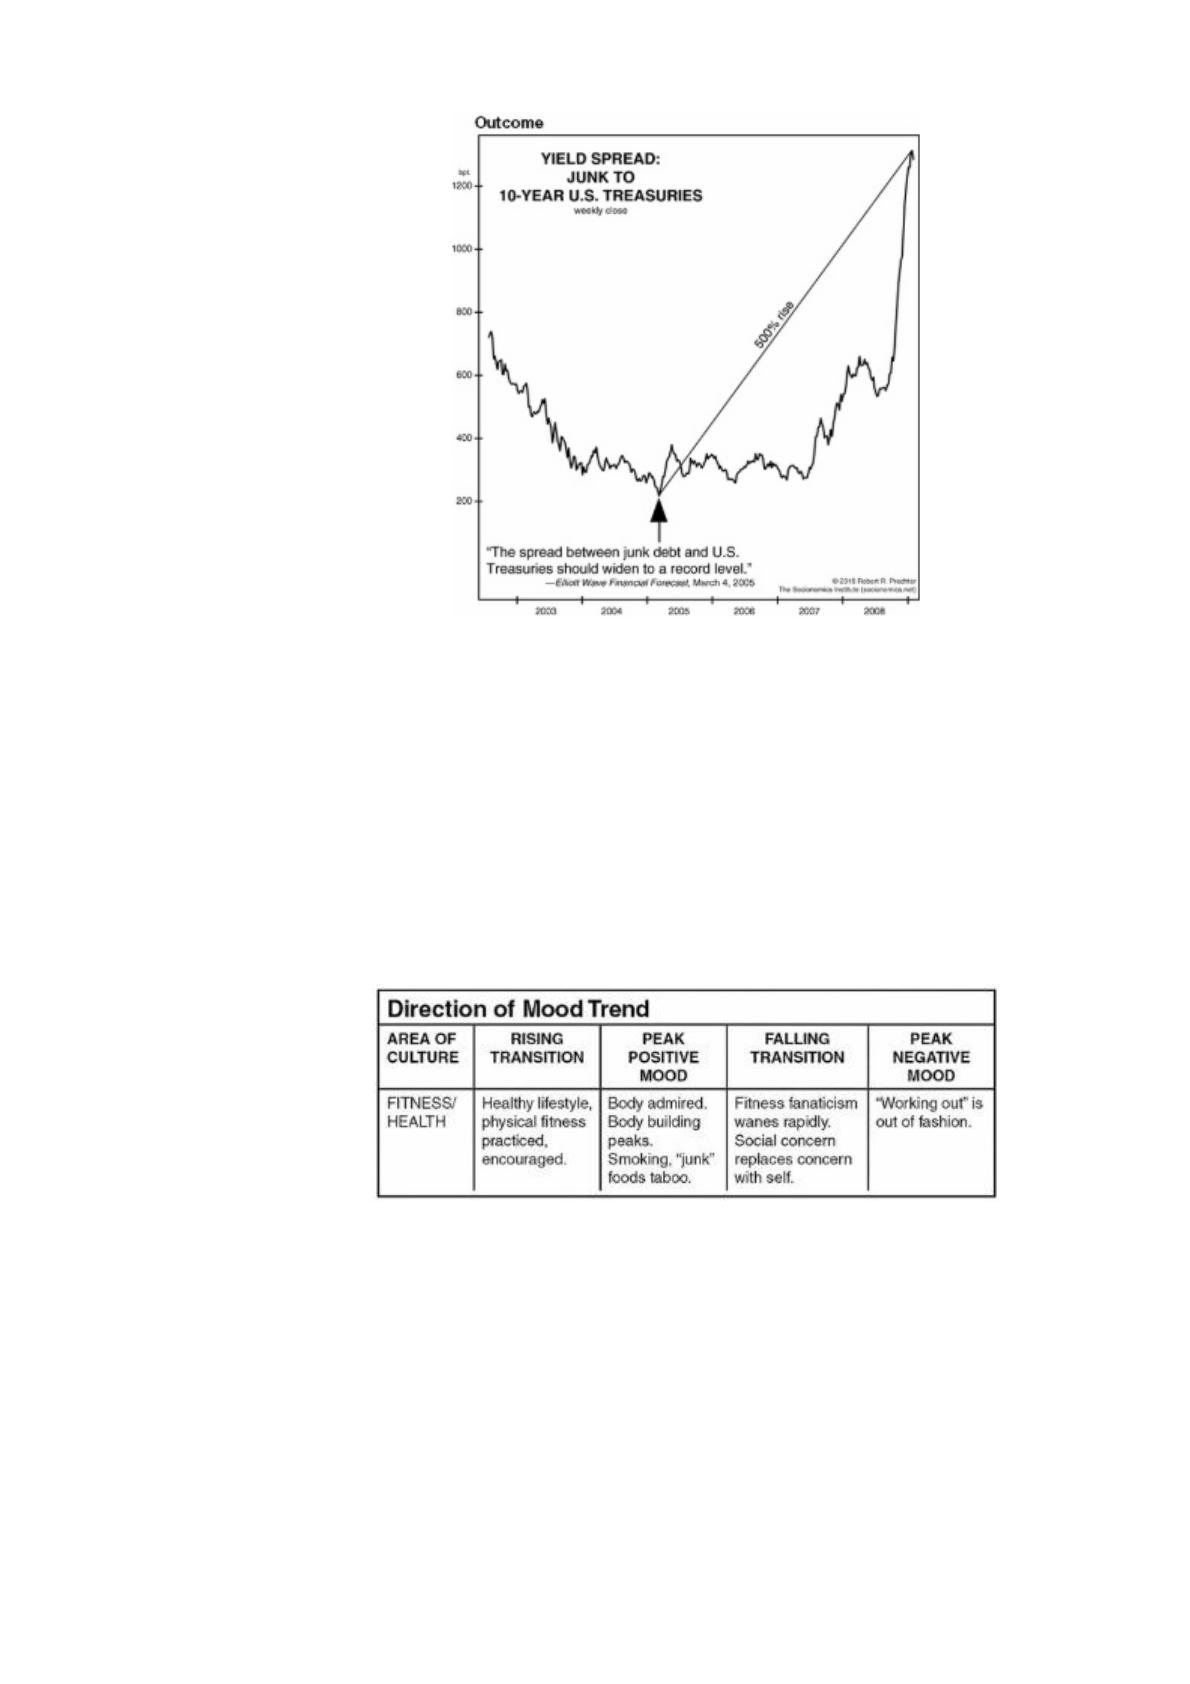
housing was booming. As it happened, their comment caught the exact low in the
spread. The stock market continued higher for another two years, so the spread hardly
budged for a while. But in 2007-2008, it took off and went to its highest level since
the early 1930s (see Figure 14). Again, that’s looking around the corner.
Figure 13
147
Figure 14
Let’s examine a non-financial idea that’s maybe a little closer to home for
many people: the desire of human beings to stay fit. In 1985, I published a little table
(see Figure 15) based on my observation that in periods of positively trending social
mood, people tend to practice and encourage physical fitness. During the 1980s and
1990s, an exercise craze took hold, and physical fitness centers became a booming
business.
Figure 15
Read what tends to happen during the Falling Transition: “Fitness fanaticism
wanes rapidly.” In other words, when social mood turns negative, people don’t want
to work out as much as they did before. This was both an observation and a
prediction.
During the boom years, a company called Bally’s Total Fitness built and ran
physical fitness centers. Figure 16 is a picture of the company’s stock price near the
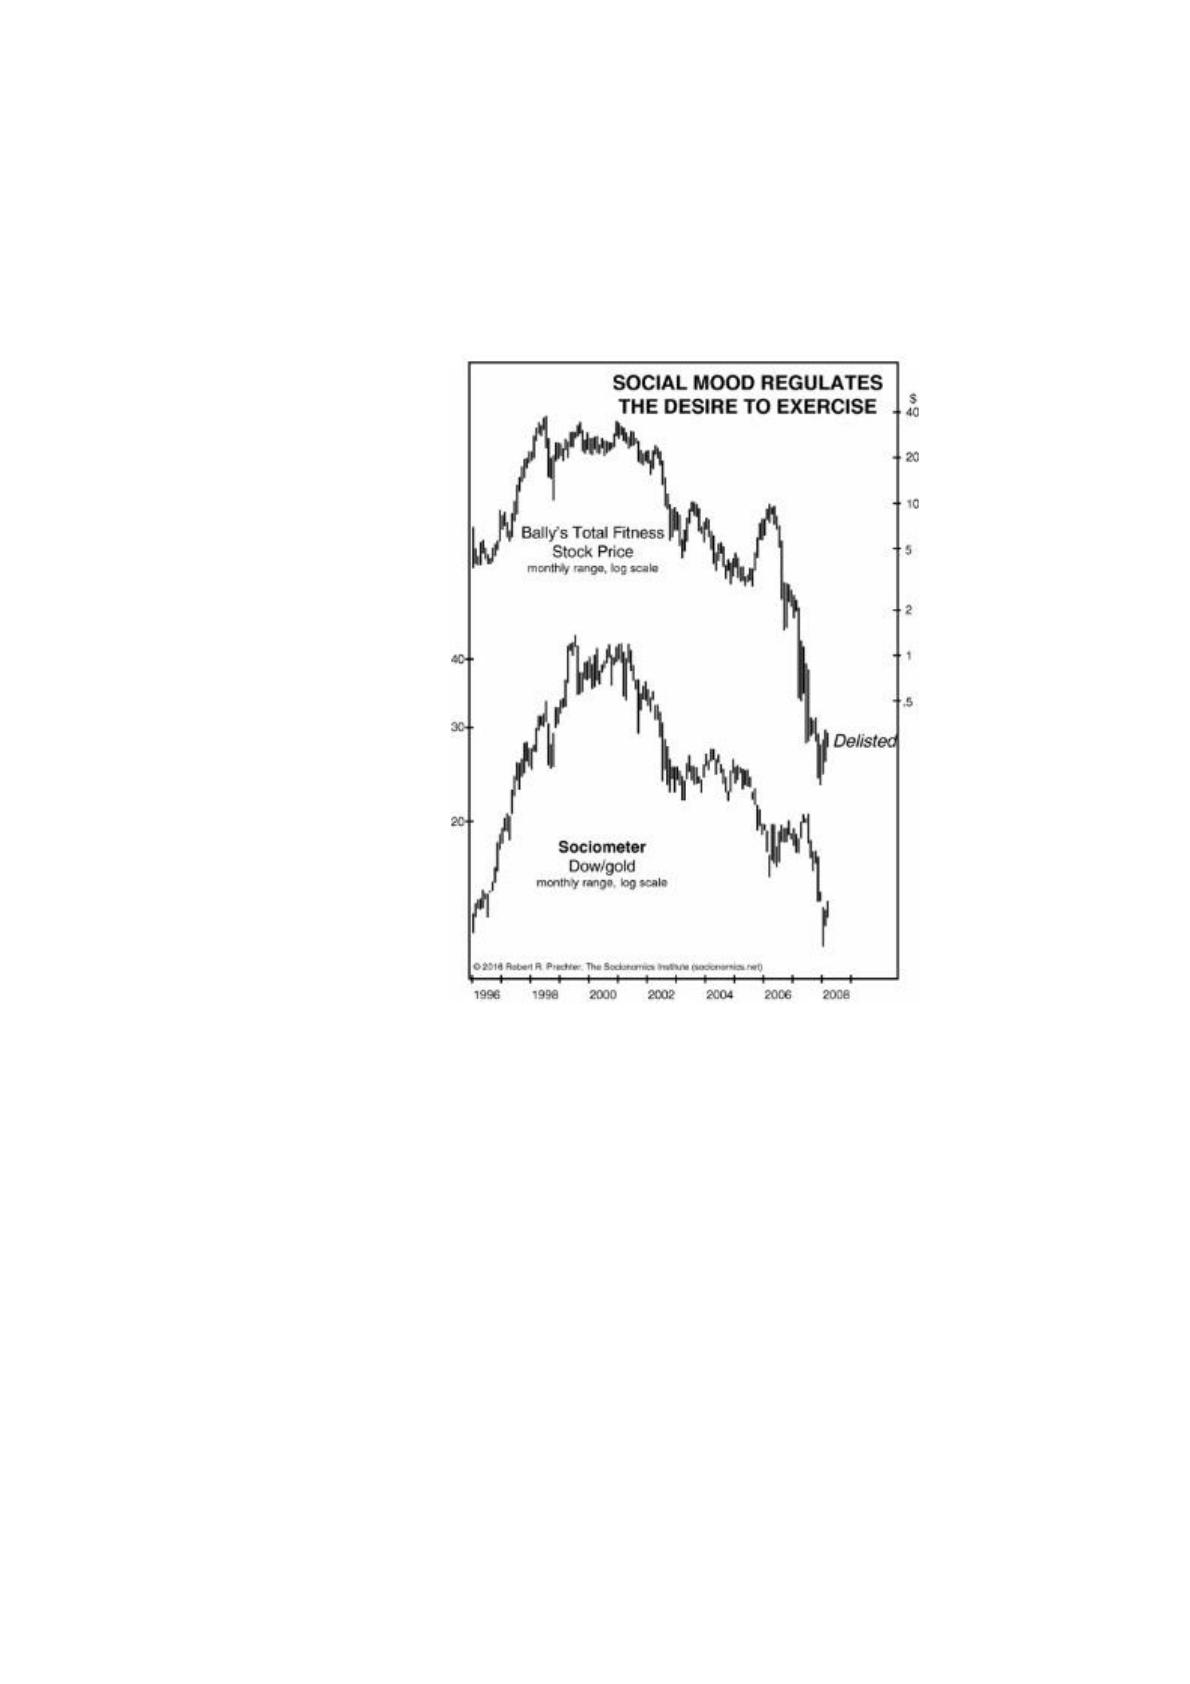
148
peak and afterward, plotted against the Dow in terms of real money (gold). You can
see that the stock’s price followed the trend of the sociometer, falling from $30 per
share all the way down until it was delisted. This collapse happened because social
mood changed. During that period, people’s increasingly negative mood kept them
from wanting to go to the gym.
Figure 16
(3) Using Stock Market Trends—Without Applying the Elliott Wave
Model—To Forecast Changes in Trends of Lagging Social Actions
The most reliable gift of the socionomic insight is that it offers a way to
forecast vitally important social trends and events without having to predict financial
prices. It is based on the time lag between some social actions and others. Chapter 8
offered numerous examples, to which three more are added here.
Major trend changes in economic variables are particularly easy to predict. The
rightward slope of the dashed lines in Figure 17 show how reliably major trends in
employment have lagged major turns in the leading sociometer. The leading
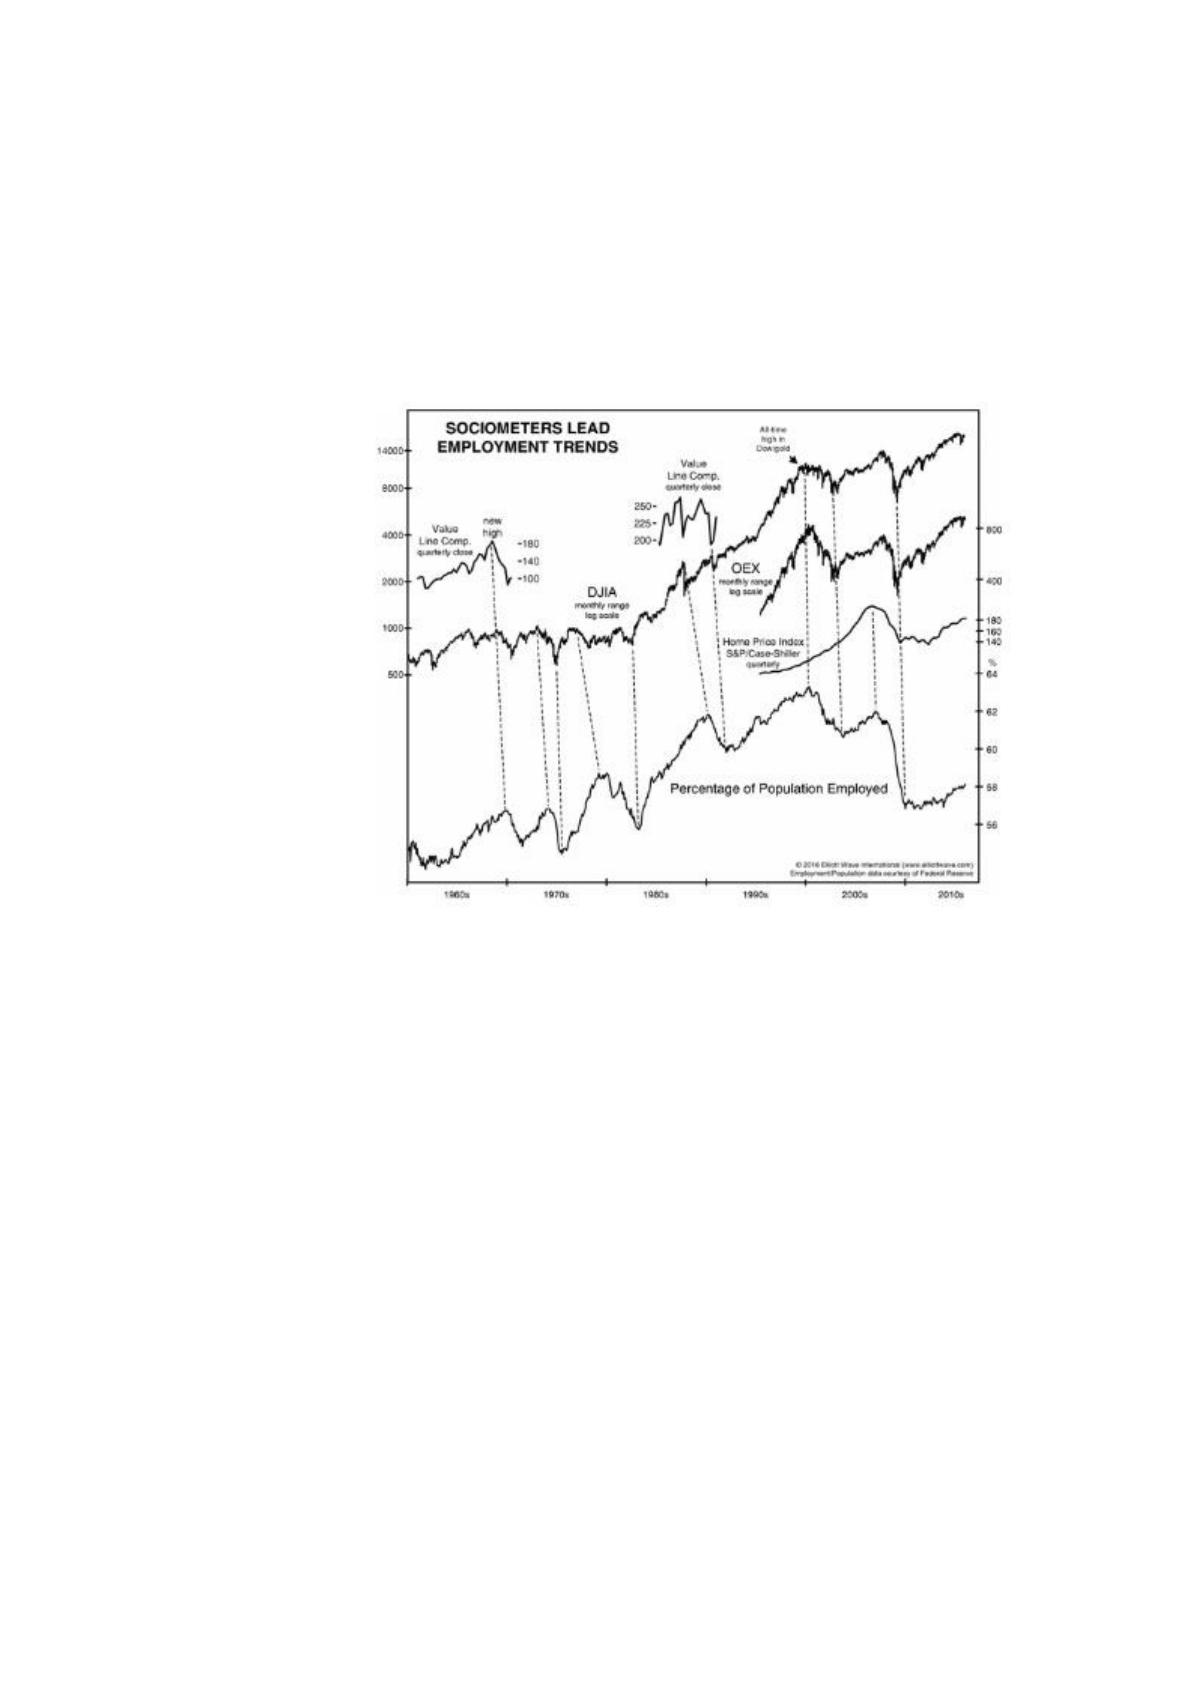
149
sociometer is usually the stock market, but in 2006 the real estate market was the
prime financial beneficiary of elevated social optimism, and that is where the reversal
from positive mood first showed up. According to the history displayed on this chart,
if you were to lag your forecasts for employment trends by one to three years at stock
market tops of at least Primary degree and by three to eight months at commensurate
stock market bottoms, you would be mostly right on both the trends and the turns.
Figure 17
If you simply want to be a step ahead of the economy most of the time, just
change your outlook as the stock market moves. Thanks to the lag, there is no need to
rush. Your record won’t be perfect, but it will be the best possible.
Delays in social action allow the socionomist plenty of time to anticipate
changes in politics, too. If the stock market has gone up for a long time, it portends
incumbent reelections and peaceful times; if it has fallen a long way, it portends
incumbents’ oustings and times of internal and external conflict; and so on.
Recall from Chapter 1 that the 9/11 attacks offered conventional futurists no
basis for stock market prediction. Neither did they have a basis for describing initial
conditions under which such attacks would likely occur. Socionomic thinking did
allow for a specific stock market prediction thereafter (see Chapter 41), and it had

150
previously offered a basis for anticipating the social-mood environment that would
encourage acts of terrorism. We had specifically predicted that in an upcoming bear
market environment, “Foreigners will commit terrorist acts on U.S. soil. [A] few
buildings…may be…bombed out of existence.” The eighteen-month stock market
decline preceding 9/11 portended social actions of just such negative character.
It is more important to predict social environments when deadly political acts
are likely than it is to predict the stock market. It is also easier; just let the trend of the
averages tell you when social mood is becoming more positive or negative and to
what degree. Political events will almost always follow, with compatible character
and commensurate tenor. Socionomic Causality in Politics (2017) offers numerous
additional examples of this reliable chronology from around the world.
Socionomic prediction is valuable with respect to periods of concord and
opposition even within much smaller social units. In 1994, I had the privilege of
addressing the Market Technicians Association at its annual conference. I applied
socionomic causality to caution the organization as follows: “In the bear market, the
MTA will become more…polarized. It will become more desirous of identifying an
‘us’ and a ‘them.’ This ‘us vs. them’ dynamic could show up ultimately in the
tightening of the MTA’s membership requirement. Or perhaps in secession by a
regional affiliate. Or perhaps an east/west split of the entire organization.”
It took a while for this dynamic to manifest, but manifest it did. During the
worldwide bear market of 2000-2003—after 30 years of cohesion—the MTA
suffered extensive internal friction and ultimately a rebellion due to animosity over
several issues, one of which was the looser standards for membership serving a
policy of inclusionism that had reigned during the preceding 20-year period of
positive social mood. A number of long-time members seceded to form a more
restrictive organization, the American Association of Professional Technical
Analysts, which was incorporated the following year.
If you are a futurist who doesn’t want to learn the Elliott wave model—in fact,
even if you disbelieve WP—this is an example of how you should approach your
151
craft. Advise people about what the opportunities and risks will be depending upon
the social mood environment as evidenced by stock market trends.
(4) Lagging Sociometers Confirm Extremities in Leading Ones
On November 1, 1999, 66 years after the low of the Great Depression, Kendall
and Hochberg in The Elliott Wave Financial Forecast unequivocally conveyed the
long term implication of Congress’ latest financial law:
“Government,” The Elliott Wave Theorist has noted, “is the last sector of
society to catch on to a trend. Usually it embraces a trend after it is over.” The U.S.
government may have just provided one of its greatest-ever demonstrations of this
principle. On October 21, the Glass-Steagall Act, which purportedly had protected
the financial infrastructure by separating the bank, insurance and brokerage
industries, was effectively repealed. The Financial Services Act of 1999 “follows
several failed efforts to do away with the Glass-Steagall Act over more than two
decades.” The bill reopens the door to the securities business for banks and insurance
firms. Glass-Steagall shut the door in 1933, the year after the bear market bottom in
1932. So, after totally missing the bear market it was supposed to prevent and
protecting banks and insurance companies from six decades of rising [financial]
prices, the U.S. government will free banks and insurers to take part in a financial
consolidation that promises to be one of the biggest in history. In our opinion, this is
once again perfect timing, one year after the top in most stocks and mutual funds.
This long-term signal of the most entrenched, government-backed market consensus
in at least 65 years [is] a long-term sell signal if ever there was one.
It was an awesome call. The decade that followed provided a negative return
for stock investors, a very rare event.
(5) Fractal Extrapolation from Behavioral Extremes Regardless of Elliott
Waves, the Stock Market or Overall Social Mood
One can use the general idea of socionomic causality even without paying
attention to overall social mood. Passionate, widely shared opinions and behavior
constitute a reliable indicator of an impending reversal for any social trend. A
prediction to that effect will appear uninformed, if not preposterous, to everyone else.
152
In 1989-1990, the market for collectible coins was hotter than ever. Over the
previous decade, rare coins had risen in price more than any major investment. Prices
were thirty times their level of 1974 and even three times their level of January 1980,
when gold and silver had topped out. Brokerage firms were embracing rare coins as a
new asset class, and they pledged a quarter of a billion dollars to buy coins for their
newly created investment funds. In April 1990, high-grade coins made a new all-time
high while medium-grade coins fell short of matching that feat, signaling (as noted in
Chapter 7) a maturing trend. Based on these signs of peak zeal, The Elliott Wave
Theorist on May 28, 1990 showed a chart of coin prices and cautioned, “The risk in
this market now…is tremendous and increasing. A loss of 50%-90% would not be
out of line. Any investor overly weighted in collector coins should strongly consider
selling his collection at today’s lofty prices.”
Coin prices drifted lower throughout the summer, and in September they
crashed. By 1993, the value of brokerage firms’ coin funds had plunged by more than
half on their way to much lower prices, and the contents of several funds were
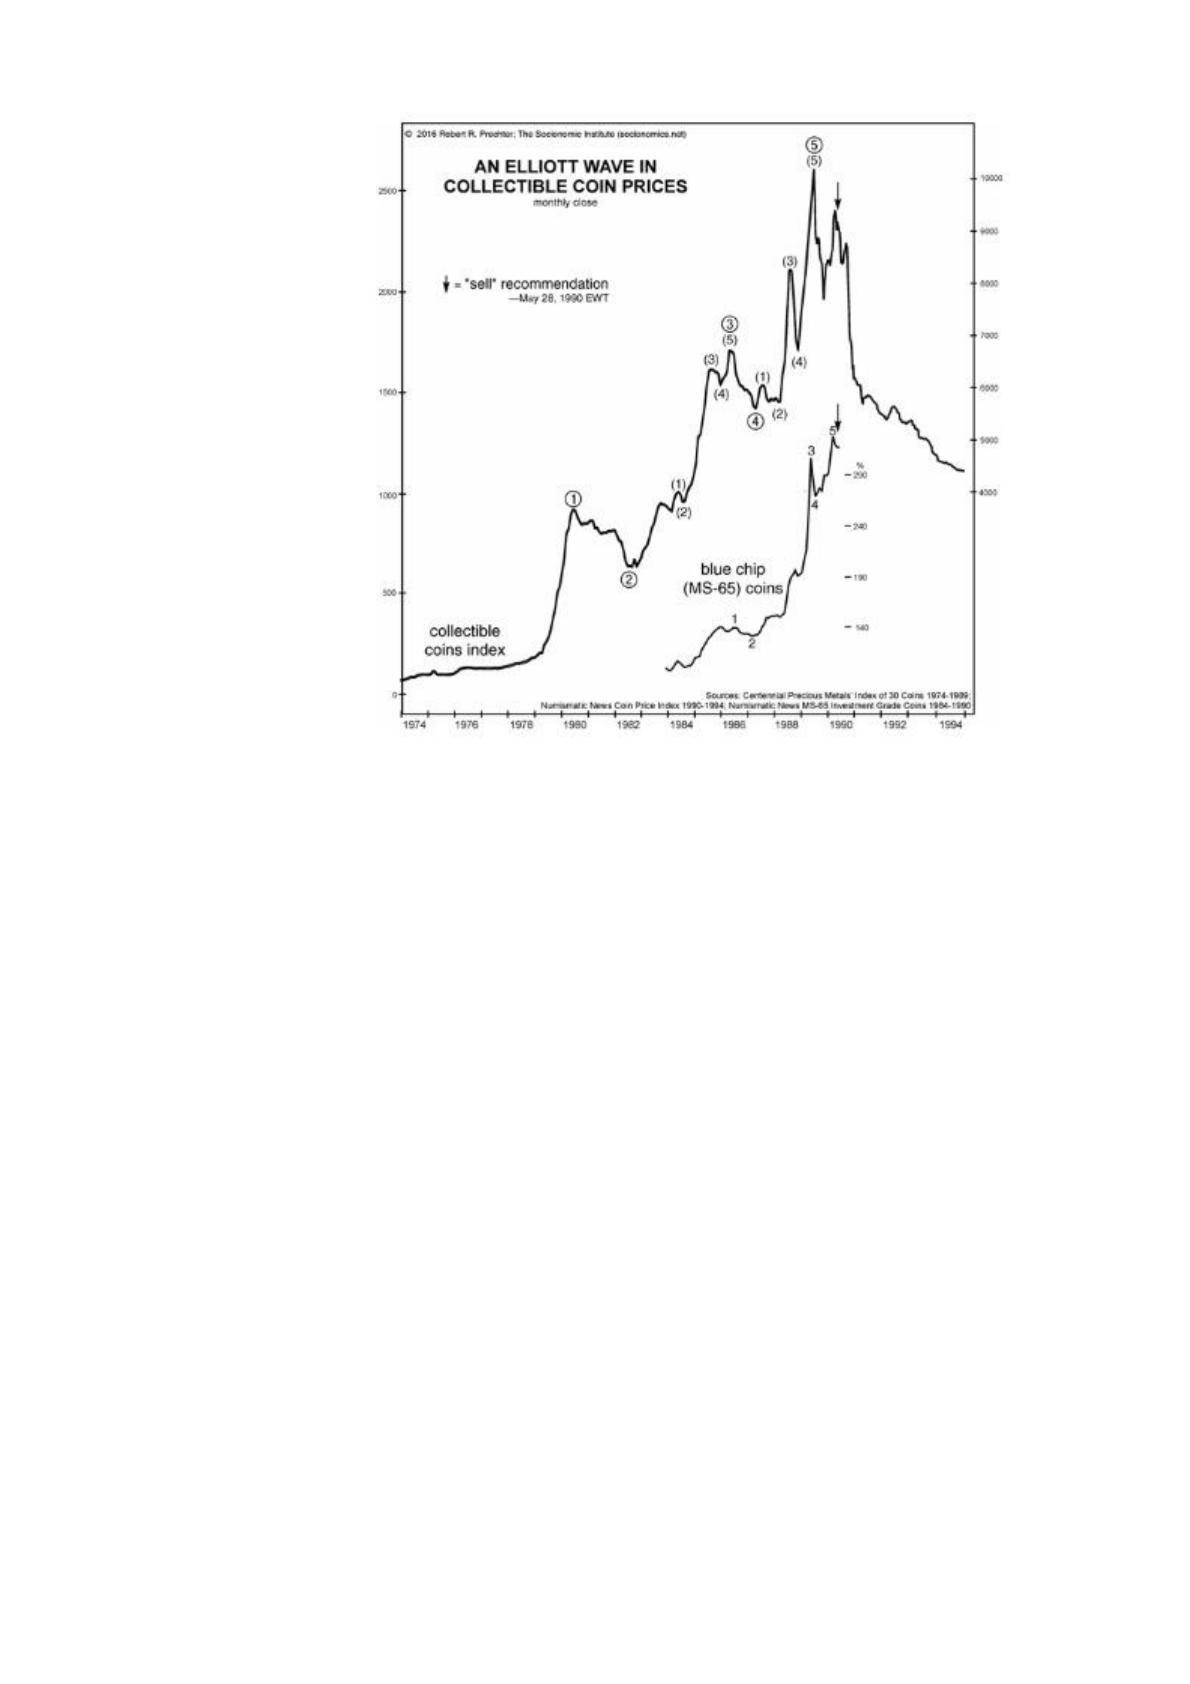
liquidated at a no-minimum-bids auction. A long term price history later made
available (see Figure 18) showed that a beautiful Elliott wave had ended in 1989-
1990.
153
Figure 18
Remember the escalating talk about the “New Economy” in the late 1990s?
The popular term in the late 1920s was “New Era.” Impressed by the replay of such
thinking, Kendall and Hochberg compiled data on the media’s escalating use of the
modern expression and predicted that it would lead to disappointment. In order to
anticipate this outcome, they didn’t need to study the stock market or apply Elliott
waves; they needed only a socionomic mindset. The Elliott Wave Financial Forecast
published Figure 19 in February 2000, one month before the peak of the dot-com
bubble, which led to a bear market that ultimately culminated in the Great Recession
of 2007-2009.